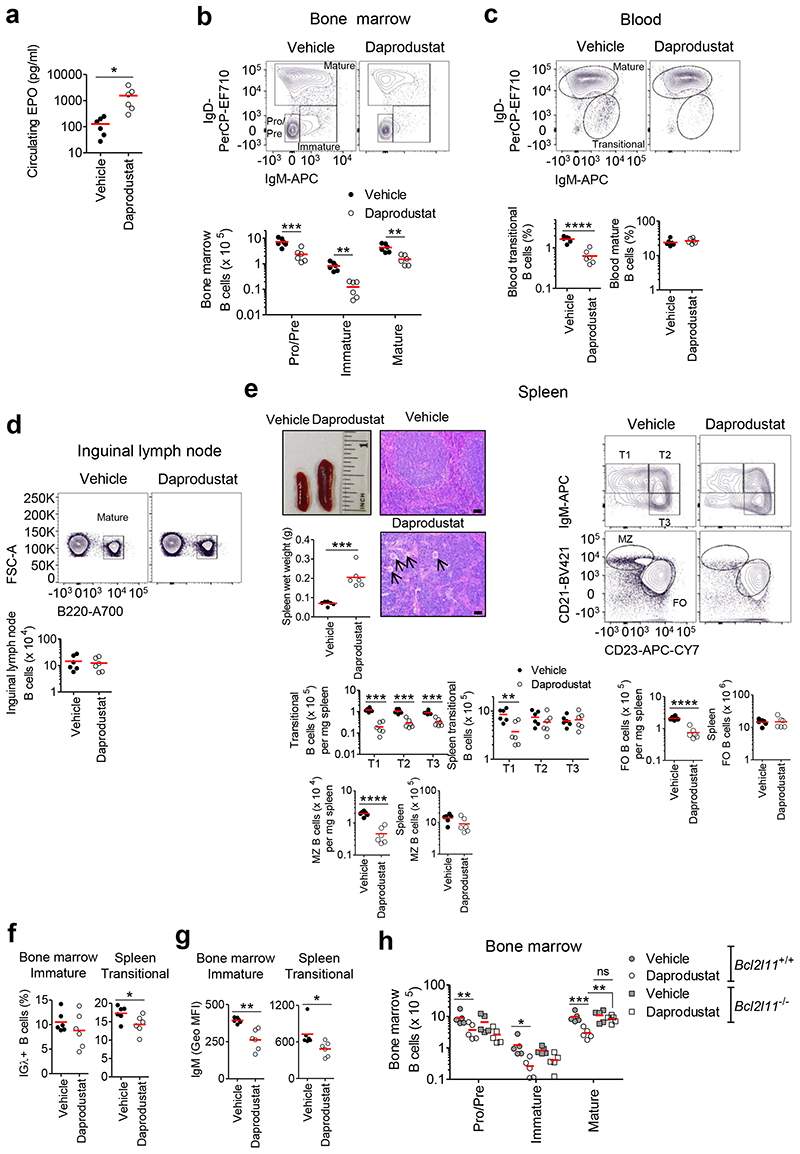
Figure 7. Developing B cells are reduced in daprodustat treated mice.
C57BL/6J mice were treated for 8 days with vehicle (2% DMSO, PBS) or 30 mg/kg daprodustat every 12 h. (a) Erythropoietin (EPO) ELISA on serum from vehicle and daprodustat treated mice. Flow cytometry showing the gating, frequency of live or absolute numbers of B cells from vehicle or daprodustat treated mice, in (b) BM, (c) blood, (d) ILN and (e) spleen. Displayed, spleen wet weight and representative images of whole spleens and structure by hematoxylin and eosin staining from vehicle and daprodustat treated mice. Arrows identify megakaryocytes, characteristic of extra-medullary hematopoiesis. Scale-bar 100 μm. (f) Percentage of IGλ+ BM immature and spleen transitional B cells and (g) mean sIgM expression (GEO MFI) on BM immature and spleen transitional B cells, from vehicle and daprodustat treated mice. (h) Flow cytometry showing the enumeration of BM B cell subsets from WT (Bcl2l11+/+) or Bcl2l11–/– mice treated for 8 days with vehicle or 30 mg/kg daprodustat every 12 h. (b-h) Gated as in Figure 1. (a,c-g) *P<0.05,**P<0.01,****P<0.0001 unpaired two-sided t test, (b,e,h) *P<0.05,**P<0.01, ***P<0.001 two-way ANOVA Bonferroni post-test or one-way ANOVA Tukey post-test. (a-g) n=6 biologically independent mice per group. Data are representative of two independent experiments, (h) n=5 biologically independent mice per group, from one experiment. (a-h) Symbols represent individual mice, bars means ± S.D.

