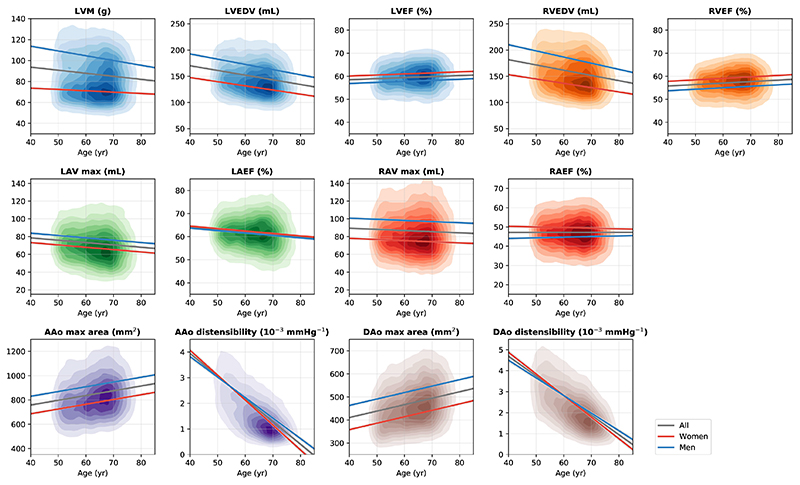
Figure 2. Associations of selected imaging phenotypes with sex and age.
Each graph displays a kernel density plot of an imaging phenotype plotted against age, as well as the linear regression lines for the whole population (gray), for women (red) and for men (blue). n = 23,415 subjects were included in the analysis. Detailed regression coefficients and association p-values can be found in Supplementary Table 7.

