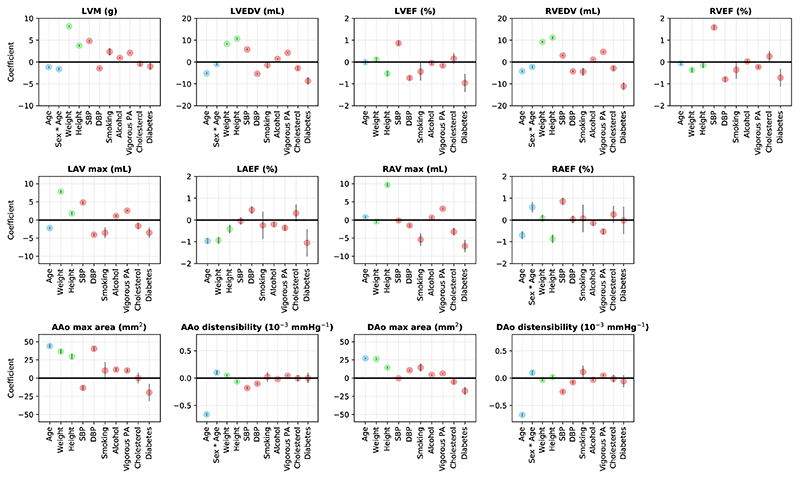
Figure 3. Regression coefficients for cardiac and aortic imaging phenotypes on demographics (blue), anthropometrics (green) and cardiovascular risk factors (red).
For continuous variables, the coefficient describes the effect per standard deviation of the variable. For binary variables, the coefficient describes the effect with a change in the variable from 0 to 1. The gray bars denote the 95% confidence interval. n = 19,988 subjects were included in the analysis.

