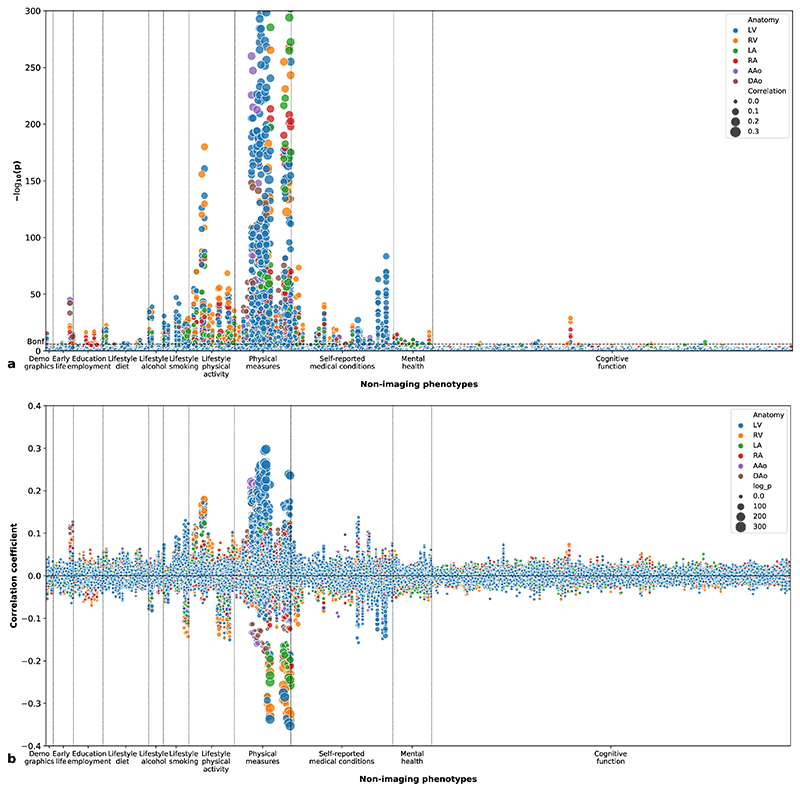
Figure 5. Phenome-wide association study.
(a) Manhattan plot showing the p-values (two-sided t-test) for correlations between imaging phenotypes and non-imaging phenotypes. The height of each data point denotes the negative logarithm of the univariate correlation p-value between one imaging phenotype and one non-imaging phenotype. The area of the data point denotes the absolute value of the Pearson’s correlation coefficient. The colour of the data point denotes the anatomical structure of the imaging phenotype. The Bonferroni threshold for multiple comparisons (α = 0.05) is shown as a dashed horizontal line. n = 26,893 subjects were included in the analysis. (b) Plot showing the Pearson’s correlation coefficients between imaging phenotypes and non-imaging phenotypes. The height of each data point denotes the correlation coefficient and the area denotes the negative logarithm of the p-value (two-sided t-test).

