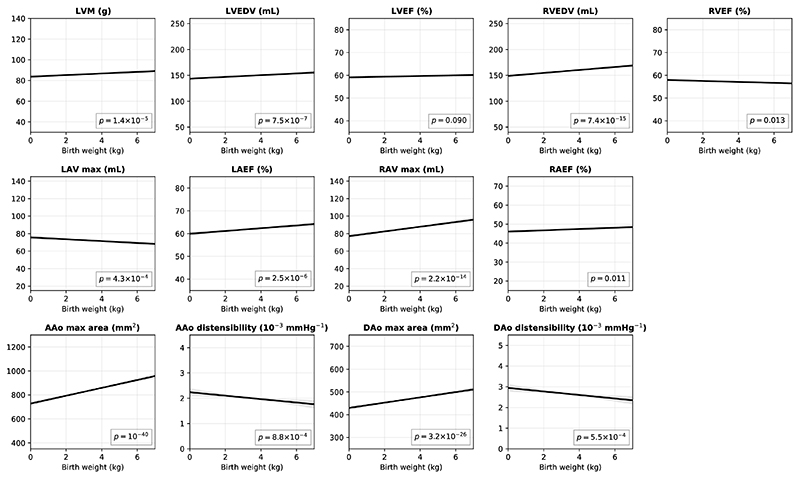
Extended Data Figure 1. The conditional plots of imaging phenotypes against birth weight.
The dark line denotes the conditional plot of an imaging phenotype against birth weight, with other variables (sex, age, sex * age, weight, height, SBP, DBP, current smoking status, alcohol intake, vigorous PA frequency, high cholesterol and diabetes) set to their mean. The grey area denotes the 95% confidence interval. n = 12,169 subjects were analysed with available birth weight information. The p-values were calculated from two-sided t-tests.

