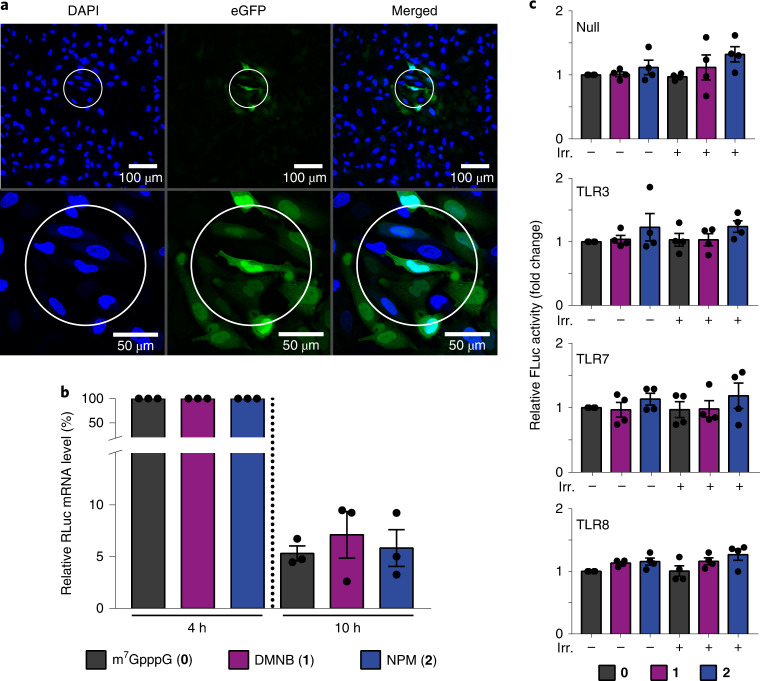
Fig. 6. Spatio-temporal control of translation, stability and the immune response of FlashCap-mRNAs in cells.
a, Irradiation of the circled area in a confocal laser scanning microscope and analysis of fluorescence of HeLa cells transfected with FlashCap 2-eGFP-mRNA. Nuclei are stained by DAPI (blue). Scale bars, 100 µm or 50 µm (zoomed). Individual colour channels were adjusted. Shown is one representative image from n = 3 independent experiments. The microscopy images were hyperstacked and the background subtracted (30 pixels) with ImageJ. b, Stability of FlashCap-mRNAs. RT–qPCR data show the relative RLuc-mRNA level at 4 h or 10 h post transfection in HeLa cells. The 4-h time point is used for normalization and was set as 100%. Data of n = 3 independent experiments are shown as mean values ± s.e.m. c, Immune response of FlashCap-mRNAs. Shown is the FLuc activity of four different HEK-NF-ĸB cell lines (Null, TLR3, TLR7, TLR8) transfected with differently capped RLuc-mRNAs (either cap 0 or FlashCap 1 or 2). TLR3, TLR7 and TLR8 indicate the overexpression of the respective TLR in that cell line. Data are normalized to the cap 0-mRNA without irradiation. Data of n = 4 independent experiments are shown as mean values ± s.e.m.

