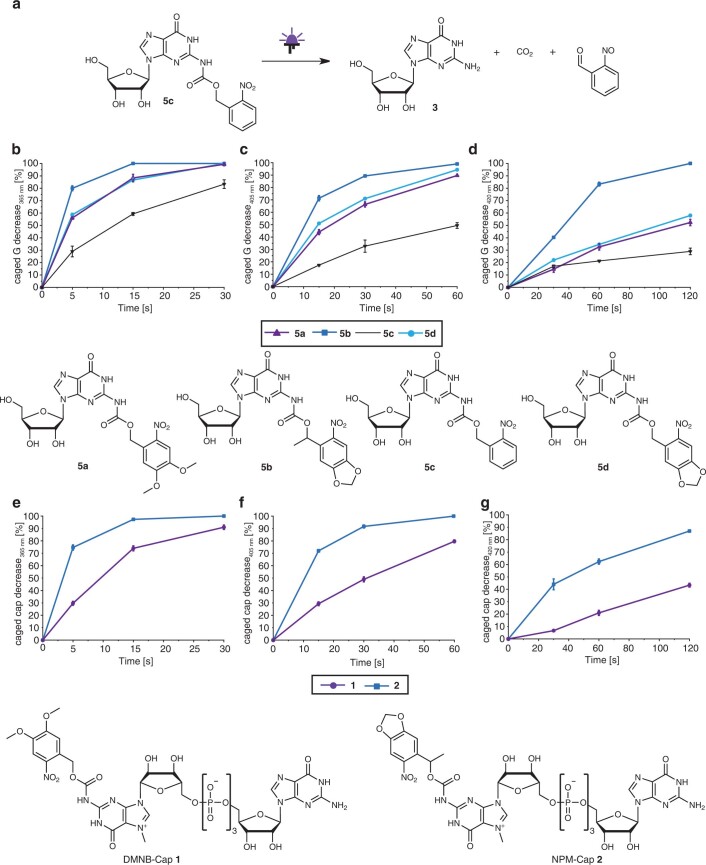
Extended Data Fig. 1. Irradiation studies of photocaged guanosines and FlashCaps.
Photo-cleavage reaction by the example of 5c (a). Illustration of the decrease of caged guanosine (G) after irradiation with 365 nm (b), 405 nm (c) or 420 nm (d) and the decrease of FlashCaps after irradiation with 365 nm (e), 405 nm (f) or 420 nm (g) for various periods of time. The samples (500 µM) were analysed via HPLC after irradiation via LED (365 nm (142 mW/cm2), 405 nm (142 mW/cm2); 420 nm (60 mW/cm2)). The percentage of uncaged guanosine or FlashCap was calculated by integration of the resulting peaks. Data points and error bars denote mean values ± standard deviation for n = 3 independent replicates.

