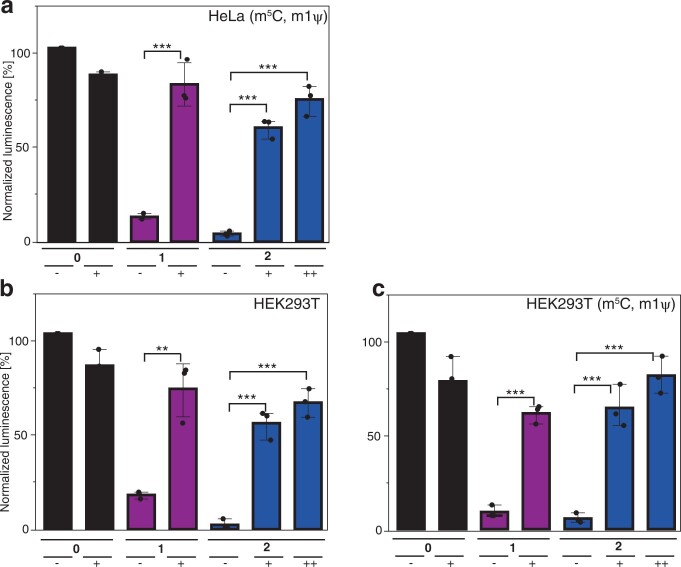
Extended Data Fig. 2. In-cell translation assay showing luciferase activity of FlashCap-GLuc-mRNAs normalized to m7GpppG-mRNA.
The samples were either irradiated before transfection (++), in cells (+) or left untreated (−). a, Measured and normalized luminescence values, which were obtained from the cell media of HeLa cells that were previously transfected with differently capped GLuc-mRNA (containing m5C and m1Ψ) either irradiated or not irradiated in a 96 well plate. The P value for 1(+) versus 1(−) is 4.66 × 10⁻⁴. The P value for 2(+) versus 2(-) is 5.70 × 10⁻⁵. The P value for 2(++) versus 2(−) is 1.16 × 10⁻⁵. b, Measured and normalized luminescence values, which were obtained from the cell media of HEK293T cells that were previously transfected with differently capped GLuc-mRNA and either irradiated or not irradiated in a 96 well plate. The P value for 1(+) versus 1(−) is 3.57 × 10⁻³. The P value for 2(+) versus 2(−) is 1.7 × 10⁻⁴. The P value for 2(++) versus 2(−) is 4.3 × 10⁻⁴. c, Measured and normalized luminescence values, which were obtained from the cell media of HEK293T cells that were previously transfected with differently capped GLuc-mRNA (containing m5C and m1Ψ) and either irradiated or not irradiated in a 96 well plate. The P value for 1(+) versus 1(−) is 9.05 × 10⁻⁴. The P value for 2(+) versus 2(−) is 9.32 × 10⁻⁴. The P value for 2(++) versus 2(−) is 2.09 × 10⁻⁴. Statistical significance was determined by two-tailed t-test. Data and error bars represent average and standard error of the mean of three independent (n = 3) cell experiments. Significance-levels were defined as p < 0.05:*, p < 0.01:**, p < 0.001:***.

