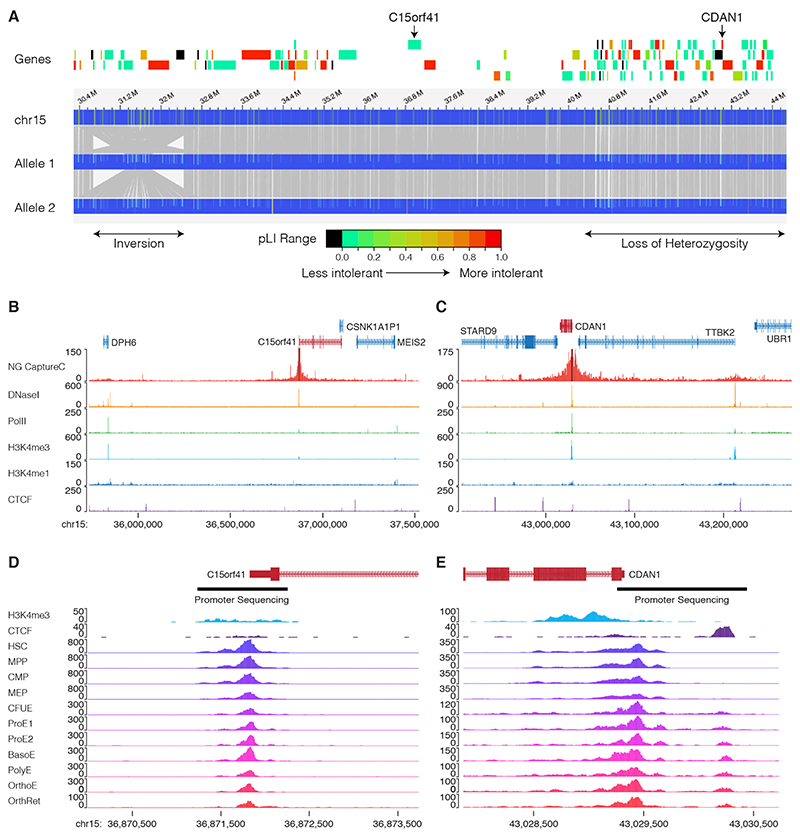
Figure 2. Evidence for a third CDA-I locus.
A. Optical mapping of ~35 Mb on chromosome 15 for patient UPID32. The locations of the inversion and the region of loss of heterozygosity are shown (lower). Protein coding genes are shown and shaded according to their constraint metric (gnomAD) and C15orf41 and CDAN1 are labelled. Optical mapping shows there are no structural rearrangements over the CDAN1 or C15orf41 loci, however, there is a homozygous inversion between 30.4 Mb and 32.6 Mb. B,C. Capture-C showing chromatin interactions of the CDAN1 and C15orf41 loci. In each case the upper track shows Capture-C demonstrating chromatin interaction counts for each captured fragment (black bars). Lower tracks show normalised (RPKM) DNaseI-seq and ChIP seq for Polymerase II (Pol2), H3K4me4, H3K4me1 and CTCF. These data show the promoters of CDAN1 and C15orf41, despite being actively transcribed (as shown by Pol2 loading and DNaseI hypersensitivity), do not interact with any other DNaseI sensitive sites decorated with the H3K4me1 mark. This suggests that neither of these genes is controlled by distal cis-acting regulatory elements in cultured erythroblasts. D. Chromatin accessibility of the genomic landscape of CDAN1 and C15orf41 during erythroid differentiation (data from references 18 & 19) shows the extent of the gene promoters. The regions of the promoters subjected to Sanger sequencing is shown by black bars Abbreviations: HSC, Haematopoietic Stem Cell; MPP, Multipotent progenitor; CMP, common myeloid progenitor; MEP, Megakaryocyte erythroid precursor; CFUE, colony forming unit erythroid; ProE1, Proerythroblast stage 1; ProE2, Pro-erythroblast stage 2; BasoE, Basophilic erythroblast; PolyE, polychromatic erythroblast; OrthoE, orthochromatic erythroblast; OrthRet, Orthochromatic/Reticulocyte.

