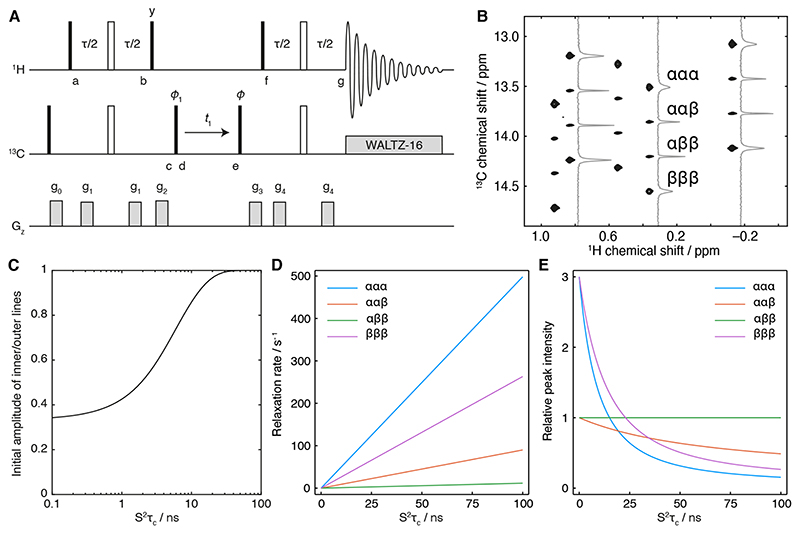
Figure 3. Analysis of the F1-coupled HSQC experiment.
(A) Pulse sequence diagram of the F1-coupled 1H,13C HSQC experiment used in this work. The delay τ is 4 ms (1/2Jch), phase ϕ1 = x, -x; receiver phase ϕrx = x, -x. States-TPPI quadrature detection is achieved by incrementing the phase of the pulse marked ϕ. Alternatively, for measurements in the time domain, the phase ϕ can be set to any value from 0 to 180°. Gradients are applied as 1 ms smoothed squares, with strengths g0 = 0.0935 T m-1, g1 = 0.0385 T m-1, g2 = 0.275 T m-1, g3 = 0.19 T m-1 and g4 = 0.07 T m-1. (B) F1-coupled 1H,13C HSQC spectrum of [2H,13CH3-Ile]-labelled FLN5 (950 MHz 1H Larmor frequency) with cross-sections illustrating the differential relaxation of 1H spin states, as indicated, within the 13C multiplet. (C) Ratio of the initial amplitudes of inner and outer transitions, Iin/Iout = (3 – Δ)/(3 + 3Δ) (Eq. 3), plotted as a function of S2τc with Δ calculated according to Eq. 2. (D) Variation in 13C single quantum relaxation rates as a function of S2τc, calculated at 800 MHz according to Fig. 2, with a 13C csa of 25 ppm. The 13C R2 has been estimated in the absence of interactions with external protons. (E) Variation in the relative intensities of transitions in the 13C multiplet as a function of S2τc, calculated from the rates in panel D by Fourier transformation of Eq. 3, including 20 Hz exponential line broadening.

