. 2022 Jun 2;28(16):3618–3629. doi: 10.1158/1078-0432.CCR-21-3189

Figure 1.

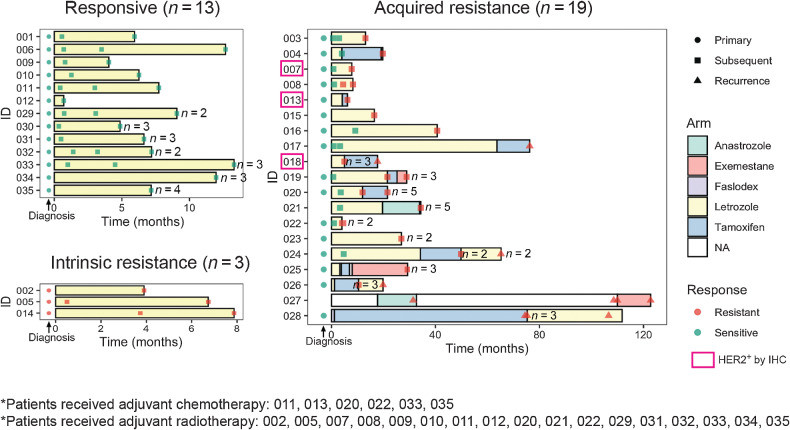
Figure 1. Patient scheme. Swimmer plot indicating timing of endocrine therapy treatment and tumor tissue sampling for each patient stratified by patient response to endocrine therapy. For each tumor sample, response to treatment defined by assessment of tumor volume change and number of biological replicates were indicated. Clinically HER2+ patients with positive IHC staining were highlighted in pink box.

Patient scheme. Swimmer plot indicating timing of endocrine therapy treatment and tumor tissue sampling for each patient stratified by patient response to endocrine therapy. For each tumor sample, response to treatment defined by assessment of tumor volume change and number of biological replicates were indicated. Clinically HER2+ patients with positive IHC staining were highlighted in pink box.