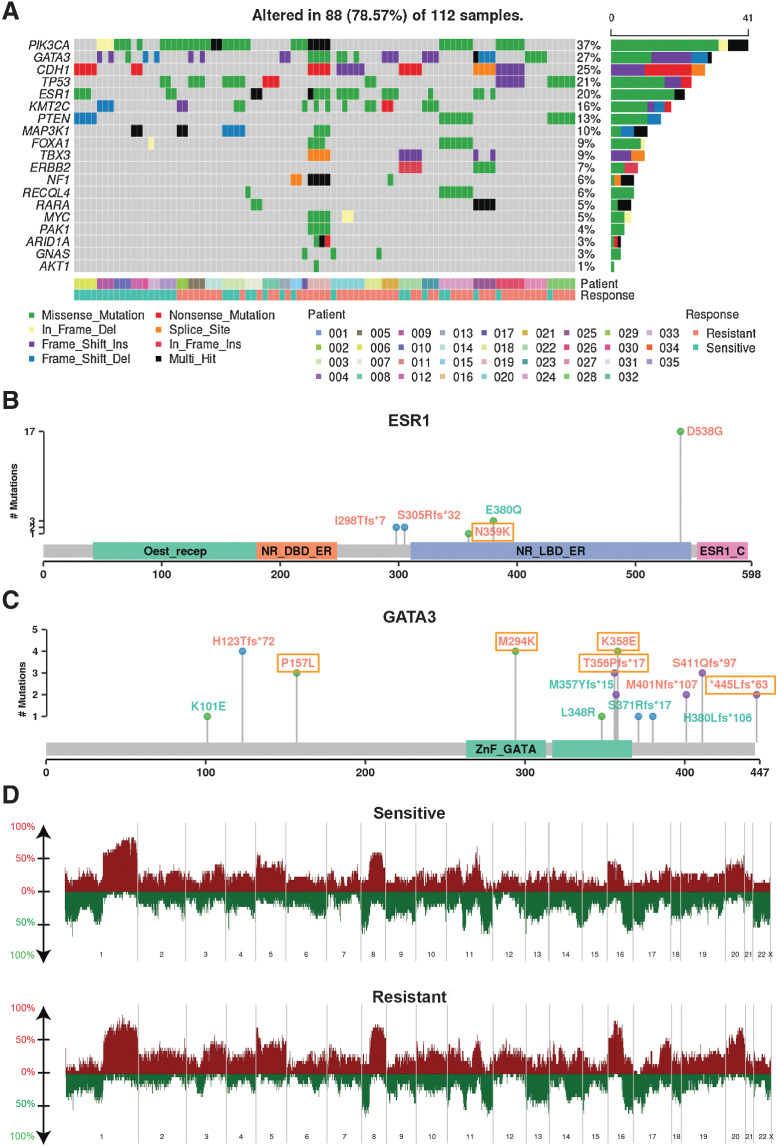
Figure 2.
Genomic characteristics. A, The pattern, frequency, and type of genomic alterations of key breast cancer genes across patients. Samples were ordered by patient and response to endocrine therapy treatment. The type of variants detected shown in lollipop plot with labeling color indicating variants observed in sensitive tumors only (cyan), that observed in resistant tumors only (orange and boxed), and that observed in both sensitive and resistant tumors (orange) for ESR1 (N = 8 patients with 23 samples; B) and GATA3 (N = 13 patient with 31 sampels; C). D, Copy number frequency landscape plots showing copy number–altered genes in sensitive and resistant tumors respectively. For each patient, copy number values were averaged among all sensitive samples and resistant samples from that patient, resulting in 23 sensitive tumors and 21 resistant tumors. Copy number gains are plotted above the x-axis in red and copy number losses are plotted below the x-axis in green. The frequency of alterations is indicated on the y-axis from 0% to 100%.

