. 2022 Jun 2;28(16):3618–3629. doi: 10.1158/1078-0432.CCR-21-3189

Figure 3.

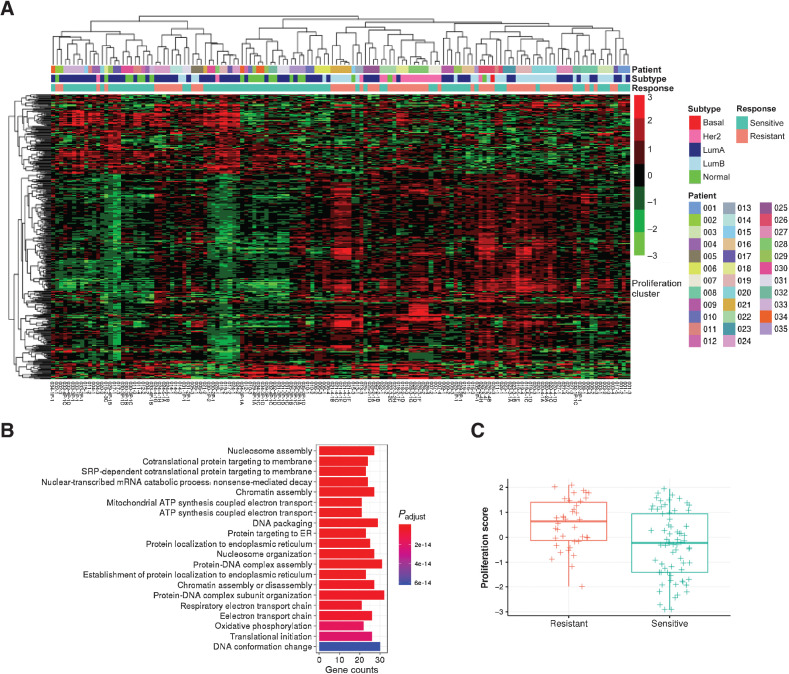
Figure 3. Differential gene expression in resistant tumors. A, Hierarchical clustering of batch corrected RNA gene expression of significantly differentially expressed genes in resistant tumors (N = 24 from 17 patients) compared with matched sensitive tumors (N = 29 from 17 patients) using linear mixed models. B, GO terms associated with upregulated genes in resistant tumors. C, Box plot indicating median score and interquartile range of proliferation scores in resistant and sensitive tumors.

Differential gene expression, in resistant tumors. A, Hierarchical clustering of batch corrected RNA gene expression of significantly differentially expressed genes in resistant tumors (N = 24 from 17 patients) compared with matched sensitive tumors (N = 29 from 17 patients) using linear mixed models. B, GO terms associated with upregulated genes in resistant tumors. C, Box plot indicating median score and interquartile range of proliferation scores in resistant and sensitive tumors.