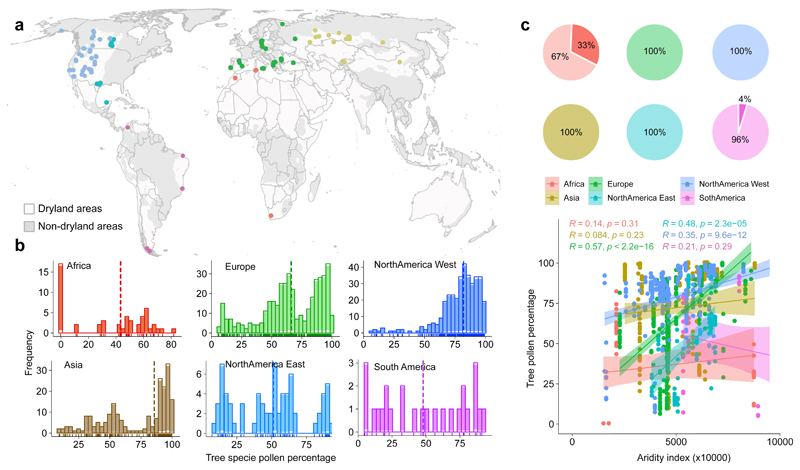
Extended Data Fig. 5. Results of the analyses of pollen samples of mid-Holocene tree species from the LegacyPollen v.1 database42.
a) Spatial distribution of the studied mid-Holocene pollen samples (n=1121 at 119 sites) overlapping with current dryland forest areas (Figure 2). b) Frequency histogram of the percentage of tree species pollen and its median represented as a dashed vertical line found in the samples per zone. c) Percentage of arboreal pollen found in the samples above 5% in pie charts (top) and Spearman-based correlation of the percentage of arboreal pollen with the aridity index (bottom). Significant in Europe (p-value < 2.2e-16), North America East (p-value = 2.3e-5) and North America West (p-value = 9.6e-12). Shades surrounding the lines represent 95% confidence interval.

