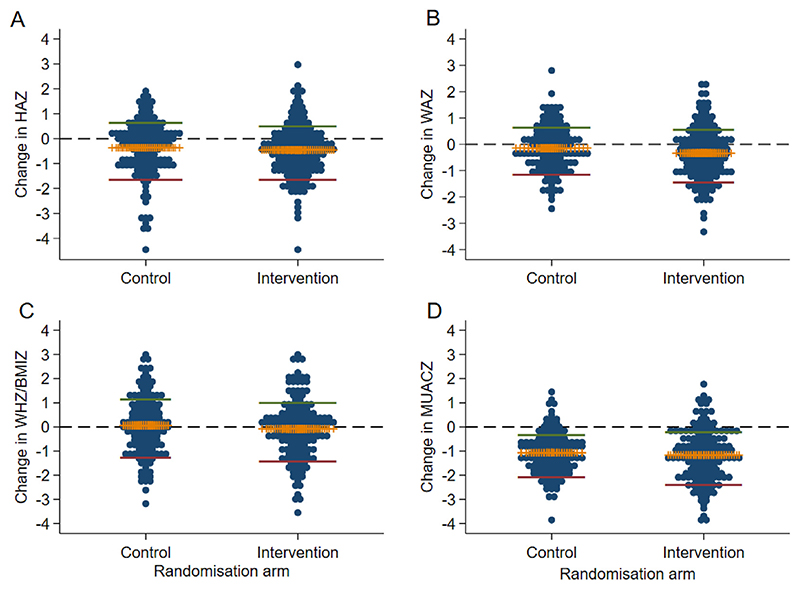
Fig. 2. Changes in growth z-scores from baseline (6−8 months) to 60−72 months.
(A) Height-for-age z-score (HAZ), (B) Weight-for-age z-score (WAZ), (C) Weight-for-height z-score (WHZ), (D) Mid-upper arm circumference-for-age z-score (MUACZ). The horizontal middle (yellow) bar represents mean change; green and red lines are upper and lower 95% confidence interval of the mean change, respectively. The line Y = 0 (black dashed line) indicates no change between the two time points. Each dot represents the value from one child.

