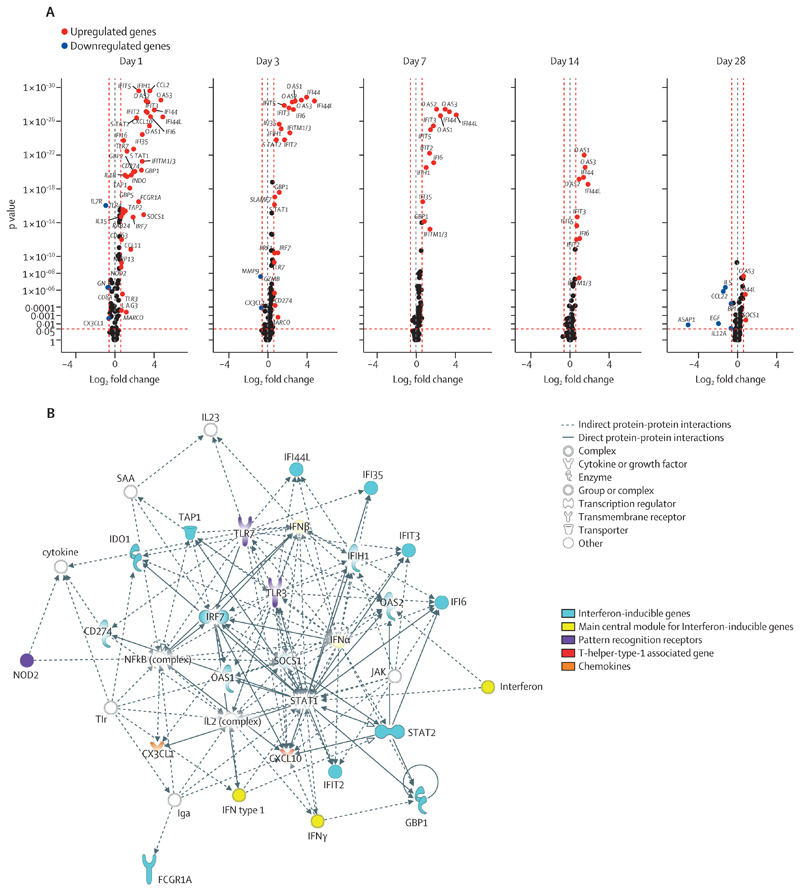
Figure 3. Identification of DEGs and key networks after rVSVΔG-ZEBOV-GP vaccination in the Geneva cohort.
Differential expression analysis was performed on GAPDH-normalised log2-transformed gene expression data of the Geneva cohort. (A) Volcano plots representing DEGs at different timepoints (days 1, 3, 7, 14, and 28) after rVSVΔG-ZEBOV-GP vaccination of all vaccinees (high dose 2 plus low dose) compared with their baseline gene expression levels. The y-axis scales of all plots are harmonised. p values are shown on a –log10 scale for better visualisation. Genes with p<0·05 and log2 fold change of less than –0·6 or more than 0·6 were labelled as DEGs. (B) Ingenuity pathway analysis interactive network analysis of DEGs identified between day 0 and day 1 following rVSVΔG-ZEBOV-GP vaccination of all vaccinees (high dose two and low dose) compared with their baseline gene expression levels. The shapes of the nodes represent the functional classes of the gene products. DEG=differentially expressed gene. IFITM1/3=IFITM1 or IFITM3, or both. rVSVΔG-ZEBOV-GP=recombinant vesicular stomatitis virus vector expressing the Zaire Ebola virus glycoprotein.

