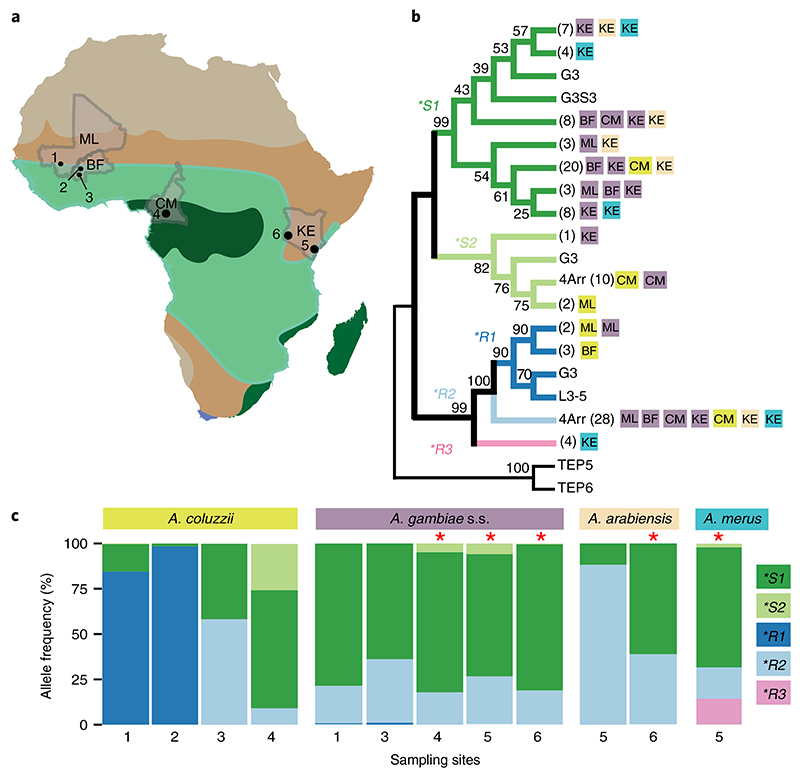
Fig. 2. TEP1 population genetics.
a, Location of sampling sites across African bioclimate zones (Supplementary Table 4) indicated by colour. Collected Anopheles species and sample sizes for each site are shown in brackets. Mali (ML): (1) (A. coluzzii, n = 116; A. gambiae s.s., n = 150); Burkina Faso (BF): (2) (A. coluzzii, n = 100) and (3) (A. coluzzii, n = 12; A. gambiae s.s., n = 47); Cameroon (CM): (4) (A. coluzzii, n = 210; A. gambiae s.s., n = 643) Kenya (KE): (5) (A. gambiae s.s., n = 17; A. merus, n = 49; A. arabiensis, n = 17) and (6) (A. gambiae s.s., n = 122, A. arabiensis, n = 67). b, Neighbour-joining comparison of TED amino acid sequences (n = 103) identified in the sampling sites by country (as in a) and by species (colour as in c), and compared to the laboratory strains G3, 4Arr and L3-5. Corresponding TED sequences of the closely related TEP5 and TEP6 (A. gambiae pest strain) were used as an outgroup for TEP1. Bootstrap values (1,000 iterations) are shown at the nodes of the plotted phylogenetic tree. Numbers of samples with identical sequences are shown in brackets. c, Distribution of TEP1 allelic frequencies per species across sampling sites 1–6. Significant deviations from Hardy–Weinberg equilibrium (calculated by χ2-test and indicated by the red asterisks) were observed in A. gambiae s.s. from sites 4, 5 and 6 (P=3.0×10⁻⁴, P=5.0×10⁻⁴, P=1.1 ×10⁻⁵, respectively); A. arabiensis from site 6 (P=1.5 ×10⁻⁵); and A. merus from site 5 (P=9.110–12). For details see Supplementary Table 4.

