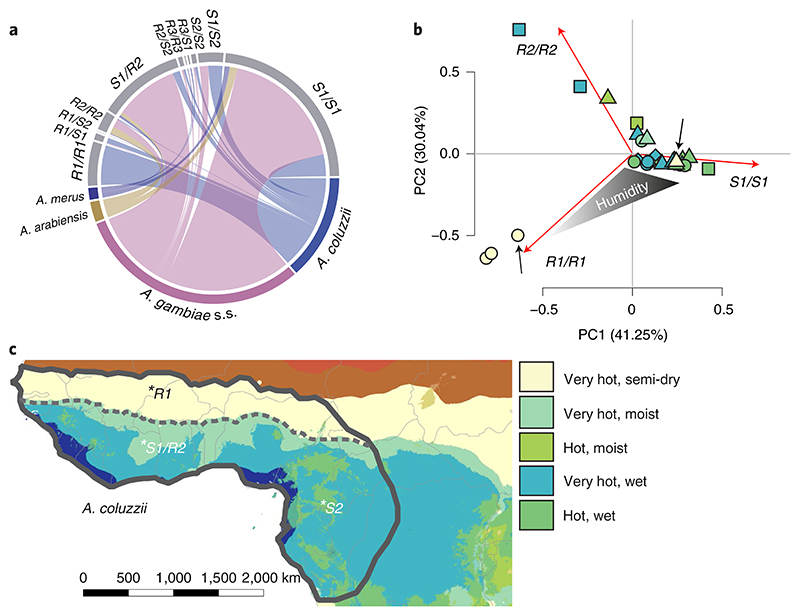
Fig. 3. Genetic and ecotype structures of Anopheles gambiae s.l.
a, TEP1 genotype composition of the species (sample sizes are indicated by the length of the species segment). A. gambiae s.s. (magenta) are predominantly represented by *S1/S1 and *R2/S1; A. coluzzii feature *R1/R1, *S1/S1 and *S1/S2. b, Principal component analysis of genotype frequencies in species and sampling locations (n = 15). Species are coded by shapes (A. gambiae s.s.; triangle; A. coluzzii, circle; A. arabiensis, square; A. merus, diamond), colours represent bioclimate zones39(as in colour legend, Supplementary Table 4). Arrows indicate the Mali sampling site where A. gambiae s.s. and A. coluzzii TEP*R1 breed in sympatry. c, Hypothesized map of the distribution of A. coluzzii ecotypes (delineated by grey lines) according to TEP1 genotypes over bioclimate zones39 (as in b). A. coluzzii ecotype distribution was deduced from this and previous studies3,29.

