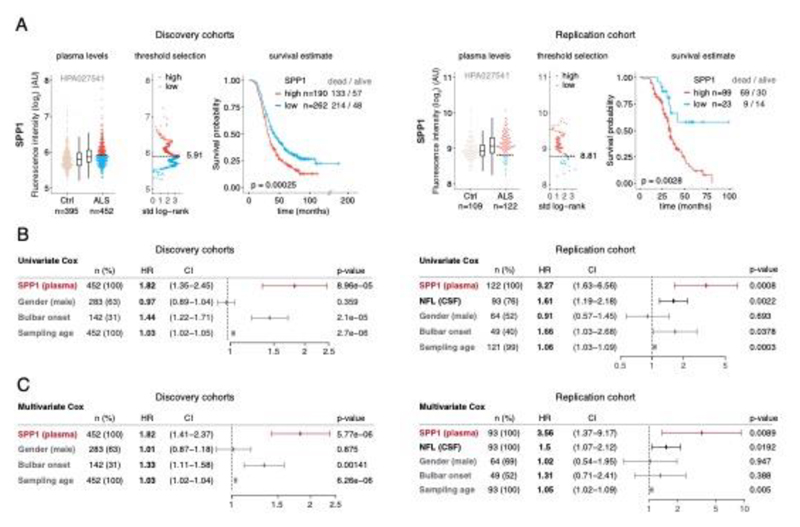
Figure 3. Prognostic value of SPP1 protein in plasma of ALS patients.
(A) Relative levels of SPP1 protein in plasma as measured by the HPA027541 antibody. Threshold selection and Kaplan-Meier survival estimates of ALS patients in discovery cohorts (Netherlands, Germany and Belgium, n=452) and in the replication cohort (Sweden, n=122). Red color indicates thresholded protein level. Thresholds are established using maximally selected log rank statistics. Boxplots show median, 2nd-3rd quartile and whiskers show +/-1.5 of the IQR. Survival probability graphs show proportion of censored patients within each arm and Kaplan-Meier logrank p-values. (B-C) Uni- and multivariate Cox proportional hazard models for continuous increase of plasma SPP1 relative to hazard ratios indicated by bulbar onset type, neurofilament light (NFL) in CSF (in the replication cohort), gender and plasma sampling age. Whiskers represent 95% CI. Cohort identity was additionally used as covariate in multivariate models.

