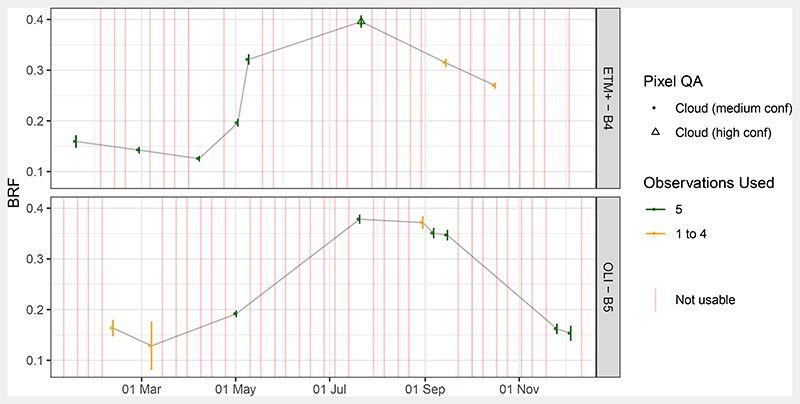
Figure 3.
Observed BRFs for Landsat 7 ETM+ and Landsat 8 OLI MSI NIR bands over the year 2016 for the five Speulderbos plots (see Figure 1). Points represent average BRF over the five sites, error bars one standard deviation. Colour codes the number of plots for which the observations were useful (clear sky). Pixel QA refers to the pixel quality bits. Six observations were discarded because they exceeded a reflectance of 1 (undetected clouds). Observations used refer to how many of the BRF of the five plots were not affected by clouds and used for analysis.

