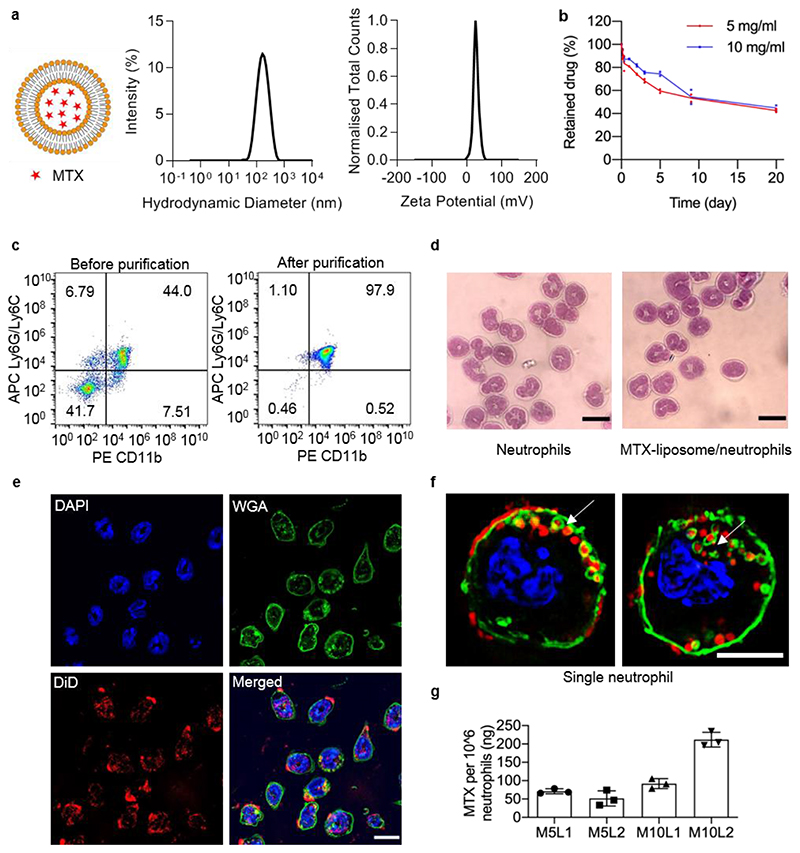
Figure 1. Preparation and characterisation of MTX-liposome/neutrophils.
a, Particle size measured by dynamic light scatting (DLS) and zeta potential distribution of MTX-liposomes. b, Quantity of retained drug inside liposomes over 20 days in PBS pH 7.4 at room temperature measured by LC-MS (n = 2 independent experiments). c, Flow cytometry analysis of the purity of isolated neutrophils before and after purification. Isolated neutrophils were double stained with PE anti-mouse CD11b and APC anti-mouse Ly6G/Ly6C antibodies. d, Morphological images of isolated neutrophils stained with Giemsa-Wright stain. Scale bar: 10 μm. e, CLSM images of MTX-liposome/neutrophils. The nuclei of neutrophils were stained with DAPI, the membranes of neutrophils were stained with WGA and the liposomes were labelled with DiD. The merged image is the overlay of the three individual images. Scale bar: 10 μm. f, Super resolution images (SIM) showing the location of MTX-liposomes on/in a single neutrophil. Full image series in Figure S4c. Scale bar: 5 μm. g, Quantity of MTX loaded in neutrophils after incubation with MTX-liposomes at different concentrations for 1 h as measured by ELISA (mean ± s.d., n = 3 independent experiments). M5: MTX 5 mg mL-1; M10: MTX 10 mg mL-1; L1: lipid concentration 1 mg mL-1; L2: lipid concentration 2 mg mL-1.

