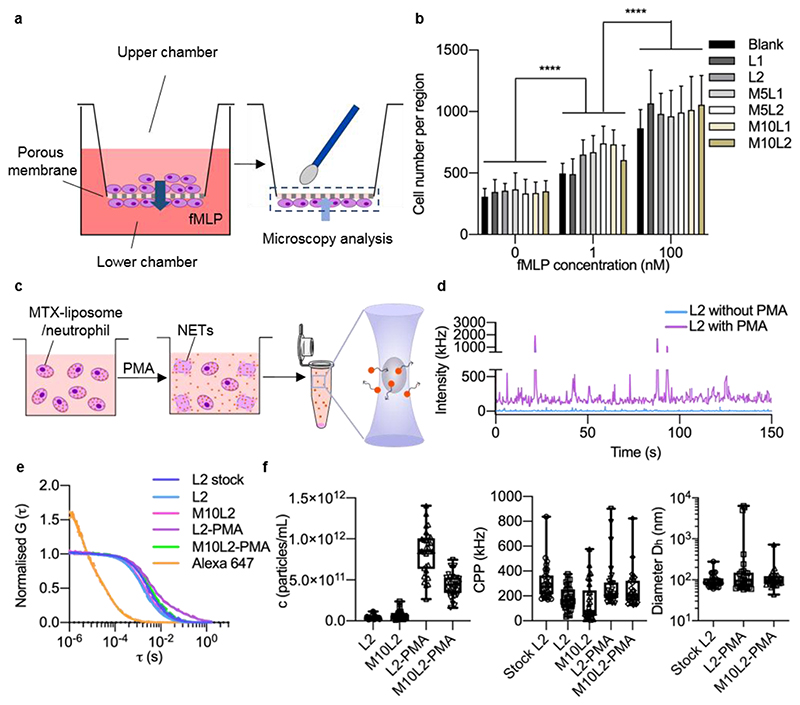
Figure 2. Migration ability of MTX-liposome-loaded neutrophils and stimulated release of liposomes (DiD-labelled) from neutrophils.
a, Schematic illustration of the in vitro model to evaluate the migration capability of liposome/neutrophils across the porous membrane using a transwell assay. Neutrophils on the bottom side of the membrane were stained with DAPI and imaged using CLSM. b, Number of migrated neutrophils on the bottom side of the membrane (mean ± s.d., n = 3 independent experiments). ****P < 0.0001, two-way ANOVA, Bonferroni post hoc test. c, Schematic illustration of the FCS sample preparation. MTX-liposome/neutrophils were prepared and cultured with or without PMA for 8 h, followed by centrifugation to collect the supernatant. FCS measurements were performed to detect the amount and properties of liposomes after release from neutrophils. The graphic of the microcentrifuge tube was adapted from the Servier Medical Art website. d, Raw fluorescence intensity traces recorded for samples collected after incubation of liposomes/neutrophils with and without stimulated release (+/- PMA). e, Average autocorrelation curves from FCS measurements (n = 30 independent measurements, 5 s each). f, Number of released liposomes given in particles per mL, signal (counts) per particle (CPP) and hydrodynamic diameter (Dh) of liposomes was calculated from the fit parameters obtained in e. Centre line, the median; box limits, upper and lower quartiles; whiskers, minimum and maximum values (n = 30 measurements per sample, repeat in SI, Figure S5).

