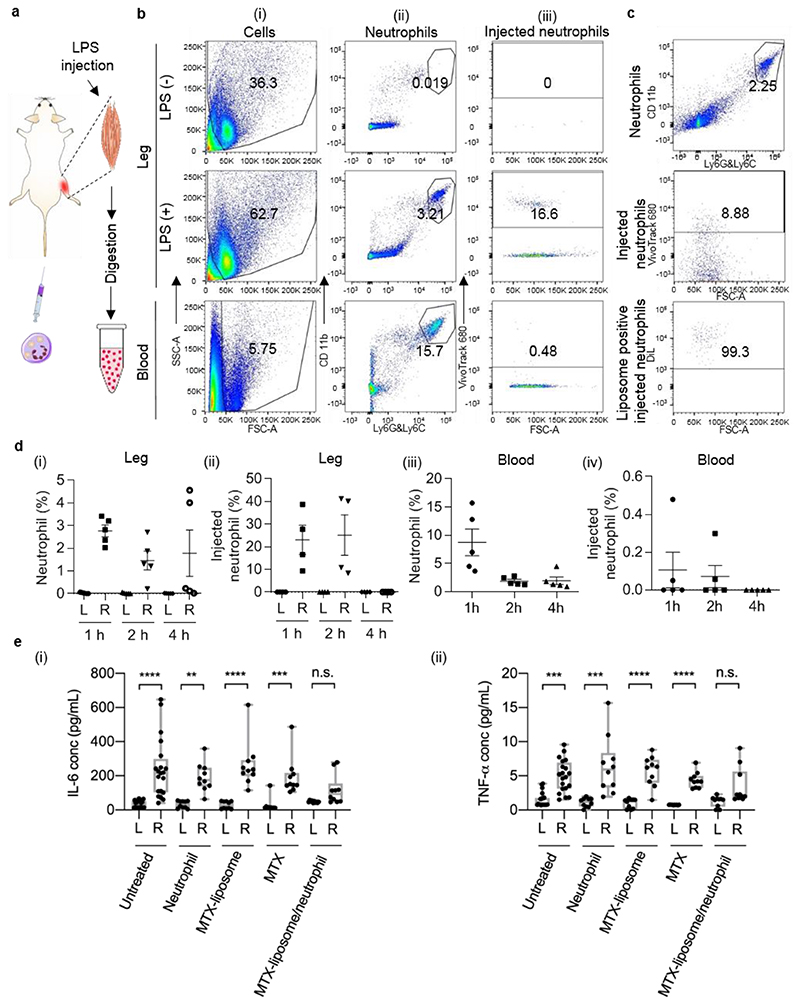
Figure 4. Targeting effect of MTX-liposome/neutrophils to the LPS-injected muscle and the resulting mitigation of inflammation.
a, Schematic illustration showing the sample preparation process of quadriceps from LPS-treated mice after i.v. injection of liposome/neutrophils (liposomes were labelled with DiL, neutrophils were labelled with VivoTrack 680) for flow cytometry analysis. The graphics of syringe and muscle were adapted from the Servier Medical Art website. b, Flow cytometry analysis of digested quadriceps after neutrophil injection (labelled with VivoTrack 680). An example of gating strategy was shown in Figure S12a. (i) Forward scatter vs side scatter plots for total counted events; gate excludes cell doublets and red blood cells. (ii) PE anti-mouse CD11b and Alexa 488 anti-mouse Ly6G/Ly6C plots for neutrophils. Gate shows the double positive population of neutrophils. For quadriceps samples, the gating area was chosen based on the quadriceps sample from untreated mouse; for blood samples, the gating area was chosen based on the blood sample from untreated mouse. (iii) Forward scatter vs VivoTrack 680 plots for injected neutrophils (analysis based on the gated CD11b+Ly6G/6C+ neutrophil population). Gate shows the VivoTrack 680 positive population of injection neutrophils compared to the total neutrophil population. c, Flow cytometry analysis of quadriceps after injection of liposome-loaded neutrophils (liposomes were labelled with DiL; neutrophils were labelled with VivoTrack 680). DiL analysis was based on the gated CD11b+Ly6G/6C+neutrophil population. d, (i) Neutrophil percentage of total cell population in the healthy quadriceps (L) and LPS-injected quadriceps (R) at 1 h, 2 h and 4 h post neutrophil injection. (ii) Percentage of injected neutrophils within total neutrophil population in the healthy quadriceps (L) and LPS-injected quadriceps (R) at 1 h, 2 h and 4 h post neutrophil injection. (iii) Overall neutrophil percentage in the blood at 1 h, 2 h and 4 h post neutrophil injection. (iv) Percentage of injected neutrophils within total neutrophil population in the blood at 1 h, 2 h and 4 h post neutrophil injection. Data shown as mean ± s.e.m., n = 5. e, (i) IL-6 level and (ii) TNF-α level in the healthy quadriceps and LPS-injected quadriceps after different treatments. Centre line, the median; box limits, upper and lower quartiles; whiskers, minimum and maximum values. **P < 0.01, ***P < 0.001, ****P < 0.0001, n.s. not significant, Kruskal-Wallis, Corrected Dunn’s post hoc test, n = 20 in the untreated group, n = 10 in other treated groups.

