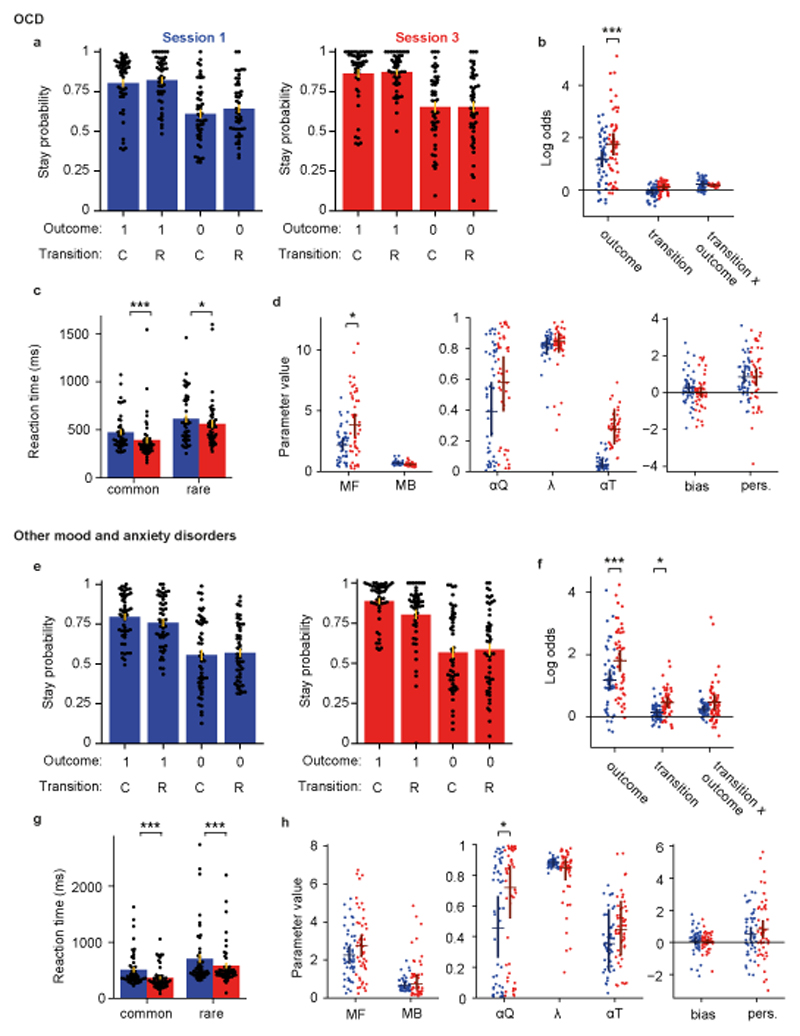
Figure 3. Impaired learning of model-based control from experience in OCD.
Participants with OCD (n=46) are represented in panels a-c, those with mood and anxiety disorders (n=49) in panels d-f. (a, e) Stay probability analysis for session 1 (left, blue) and session 3 (right, red), as figure 2a. (b, f) Logistic regression analysis of stay probabilities, as figure 2d. In the OCD group the influence of trial outcome on stay probability increased between session 1 and 3 (null 95% CI [-0.35,0.36], coefficient change=0.58, P<0.001, permutation test). In the group with mood and anxiety disorders, the influence of outcome (null 95% CI [-0.33,0.35], coefficient change=0.63, P<0.001) and transition (null 95% CI [-0.25,0.25], coefficient change=0.33, P=0.011) increased. (c, g) Second-step reaction times after common and rare transitions in session 1 and 3. In the OCD group, reaction times were faster following common than rare transitions (main effect of transition, F1,45=51.3, P<0.0001, ηp2=0.53, repeated measures ANOVA), and also in session 3 than session 1 (main effect of session, F1,45=10, P=0.003, ηp2=0.18). In the group with mood and anxiety disorders, second-step reaction times were faster following common than rare transitions (main effect of transition, F1,48=34.2, P<0.0001, ηp2=0.42, repeated measures ANOVA) and faster in session 3 than session 1 (main effect of session, F1,48=30.5, P<0.0001, ηp2=0.39). (d, h) Comparison of RL mixture model fits, as figure 2f. In the OCD group, the influence of model-free action values on choice increased between session 1 and 3 (null 95% CI [-1.36,1.32], parameter change=1.71, P=0.012, permutation test). In the mood and anxiety disorders group, the value learning rate increased between session 1 and 3 (null 95% CI [-0.21,0.21], coefficient change=0.26, P=0.011).

