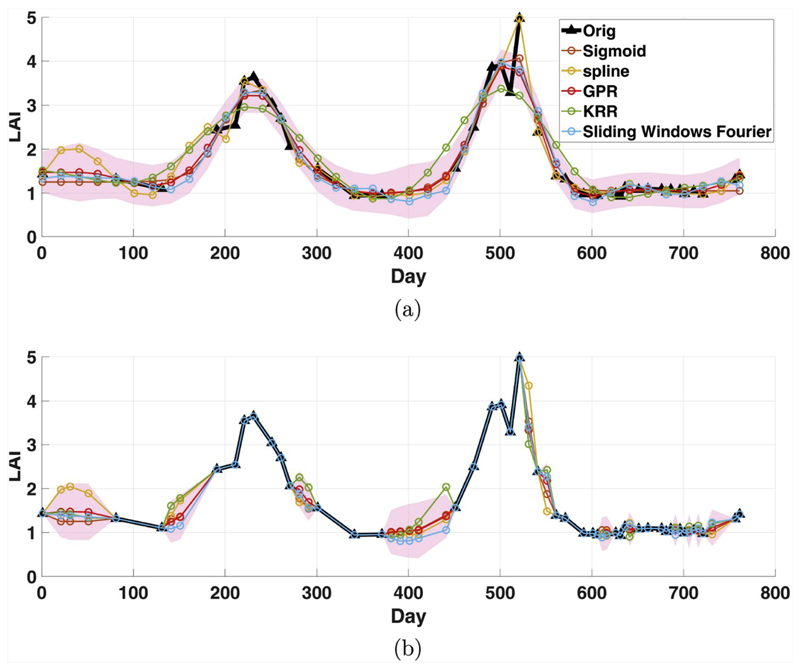
Fig. 4.
Original and reconstructed time series of LAI using several gap-filling techniques. The example applies different time settings. Interpolated values of time series at a higher sampling frequency (every 20 days) (top). Interpolated values are computed only for embedded missing values in the input time series (bottom). The GPR uncertainties are shown in red shade areas. (For interpretation of the references to color in this figure legend, the reader is referred to the Web version of this article.)

