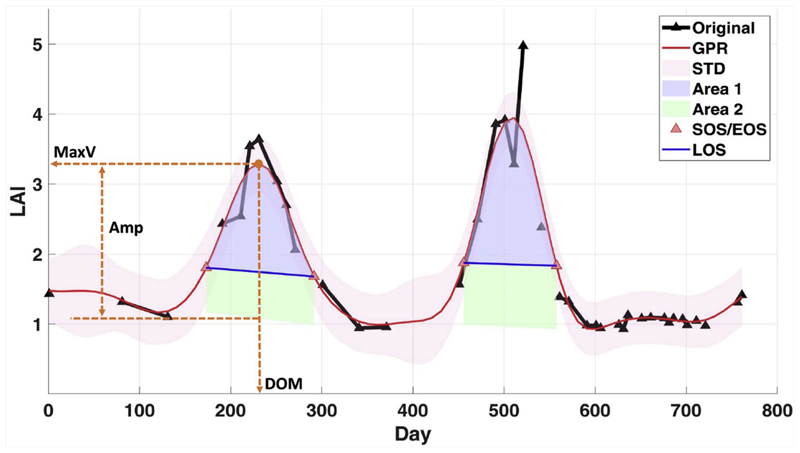
Fig. 5.
Automatic identification of some seasonal patterns computed in DATimeS by using the reconstructed LAI curve (red line) with GPR. Red shade area shows the associated GPR uncertainties (standard deviation). Purple and green colors indicate the areas under the curve between SOS/EOS (red triangles) and the left/right minimum values, respectively. Blue lines show approximately the length of seasons (LOS). Maximum value (MaxV), day of maximum value (DOM) and amplitude (Amp) are represented with orange dashed lines. (For interpretation of the references to color in this figure legend, the reader is referred to the Web version of this article.)

