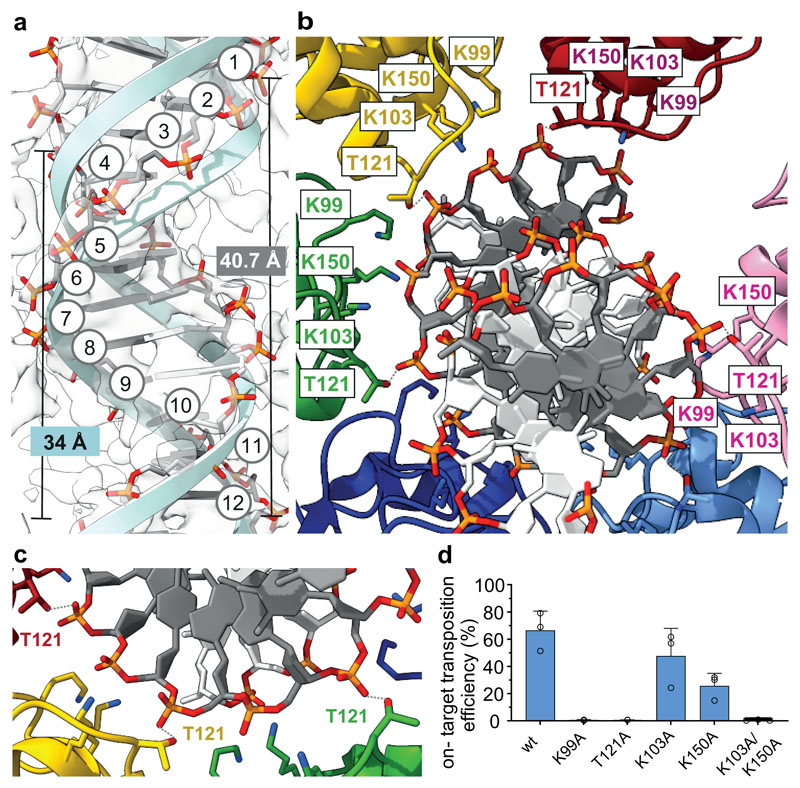
Fig. 3. DNA binding and remodeling by the ShTnsC filament.
a, Overview of the bound DNA duplex (backbone in stick representation; tracking strand, dark grey; opposite strand, white) and comparison with an ideal B form dsDNA (light blue cartoon backbone). Backbone phosphates of the tracking strand are numbered. b-c, Close-up views of key DNA-interacting residues. ShTnsC protomers are shown in distinct colors. Hydrogen bonds are indicated with grey dashed lines. d, Site-specific transposition activity in E. coli of ShCAST systems containing mutations in the DNA binding interface of ShTnsC, as determined by droplet digital PCR (ddPCR) analysis. Data are presented as mean ± s.d. (n=3 biologically independent replicates).

