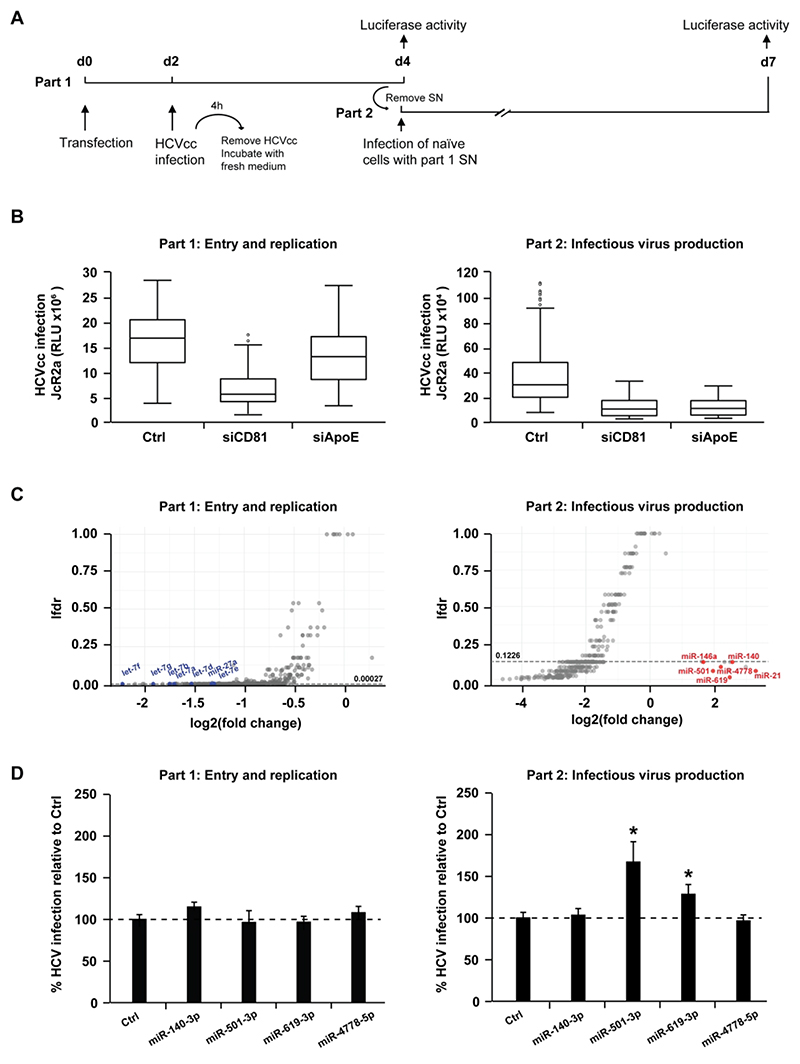
Figure 1. High-throughput screen identifies human miRNAs that regulate the HCV life cycle.
(A) Schematic outline of the miRNA mimic screen strategy. Huh7.5.1 cells were transfected with miRNA mimics or controls prior to infection with Renilla luciferase HCVcc (JcR2a) two days later (part 1). Cell supernatants of part 1 were used to inoculate naïve Huh7.5.1 cells (part 2). Cells from part 1 and part 2 were lysed at the end of each infection step (2 and 3 days post infection, respectively) to determine luciferase activity. (B) Modulation of HCV entry and replication (part 1) and/or assembly and infectivity (part 2) upon transfection of control non-targeting siRNA (siCtrl, negative control), siCD81 (inhibiting viral entry) or siApoE (inhibiting viral assembly). By inhibiting HCV entry, siCD81 impacts part 1 as well as part 2. In contrast, by specifically impairing late steps of HCV replication cycle, siApoE inhibits HCV infection only in part 2. The box plots show the sample lower quartile (25th percentile; bottom of the box), the median (50th percentile; horizontal line in box) and the upper quartile (75th percentile; top of the box) of relative light units (RLU) in each lysate. The whiskers indicate s.d. Data are from three independent experiments. (C) Effects of miRNA overexpression on each part of the HCV life cycle. Data were tested using a moderated t-test (empirical Bayes shrinkage, R-package limma[26]) for the null-hypothesis of no change of a given miRNA compared to the negative control. The resulting p-values for independent testing of each miRNA where corrected for the multiple testing situation and expressed as local false discovery rate (lfdr, R-package fdrtool[27]). miRNAs having a significant effect on either part 1 or 2 of the screen are below the thresholds indicated by dashed lines (lfdr < 0.00027 or 0.1226, respectively). miRNAs that were previously reported to impact on HCV infection as well as miR-140-3p, miR-501-3p, miR-619-3p and miR-4778-5p are highlighted in blue (Log2(FC) < 0) or red (Log2(FC) > 0). Data are from three independent experiments. (D) Effect of miR-140-3p, miR-501-3p, miR-619-3p and miR-4778-5p on the HCV life cycle. Huh7.5.1 cells were transfected with siCtrl (Ctrl), miR-140-3p, miR-501-3p, miR-619-3p or miR-4778-5p and infection experiments were carried out as described in A. HCV infection was determined as luciferase activity. Results represent mean percentage ± s.d. from three independent experiments in triplicate. The dashed line indicates values from control-transfected cells set at 100%. Statistics: *, p-value < 0.05, Mann-Whitney test.

