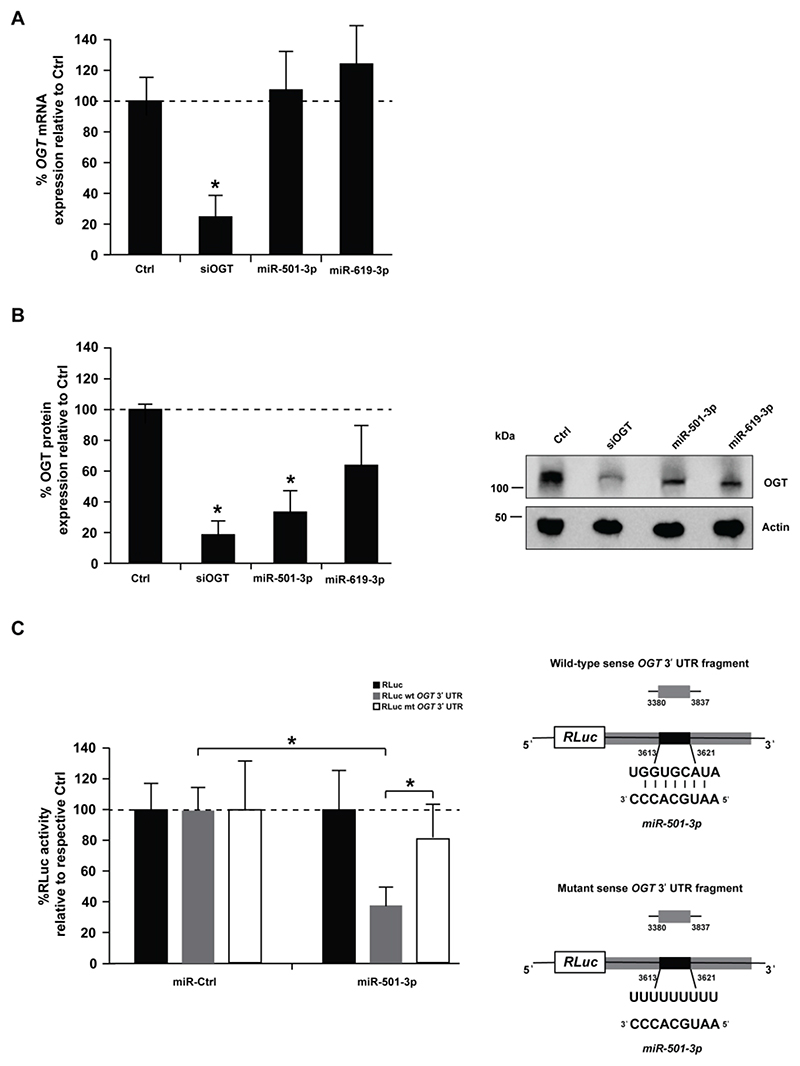
Figure 3. miR-501-3p mediates post-transcriptional regulation of OGT by decreasing its expression at the protein level.
Huh7.5.1 cells were transfected with siCtrl (Ctrl), a pool of siRNA against OGT, miR-501-3p or miR-619-3p. After 96h, RNA and proteins were purified, and OGT expression analyzed by RT-qPCR and Western blot. (A) Percentage of OGT mRNA expression in miRNA-transfected cells as compared to negative control. Results are presented as mean ± s.d. and are from three independent experiments in triplicate. The dashed line indicates values from control-transfected cells set at 100%. Statistics: *, p-value < 0.05, t-test (B) OGT protein expression. Left: percentage of OGT protein expression in siRNA- or miRNA-transfected cells as assessed by quantification of Western blots. OGT levels were normalized to actin levels using ImageLab™ 5.2.1 software (BioRad). Results are presented as mean ± s.d. and are from three independent experiments. The dashed line indicates values from control-transfected cells set at 100%. Statistics: *, p-value < 0.05, t-test. Right: representative Western blot analysis. (C) Analysis of miRNA targeting of OGT expression by dual luciferase reporter assay. Left: HeLa cells were co-transfected with a miR-501-3p mimic and a dual luciferase reporter plasmid containing either wild type miR-501-3p (RLuc wt OGT 3’UTR) or mutated miR-501-3p binding site (RLuc mt OGT 3’UTR) to modulate RLuc expression. Co-transfection of the miR-501-3p mimic and empty RLuc vector was used as control. Data are expressed as mean percentage of Renilla luciferase activity ± s.d. normalized to firefly luciferase, and relative to co-transfection of the vectors with non-targeting miRNA (miR-Ctrl). Results are from three independent experiments in triplicate. The dashed line indicates values from control-transfected cells set at 100%. Statistics: *, p-value < 0.05, t-test. Right: Schematic representation of the used constructs.

