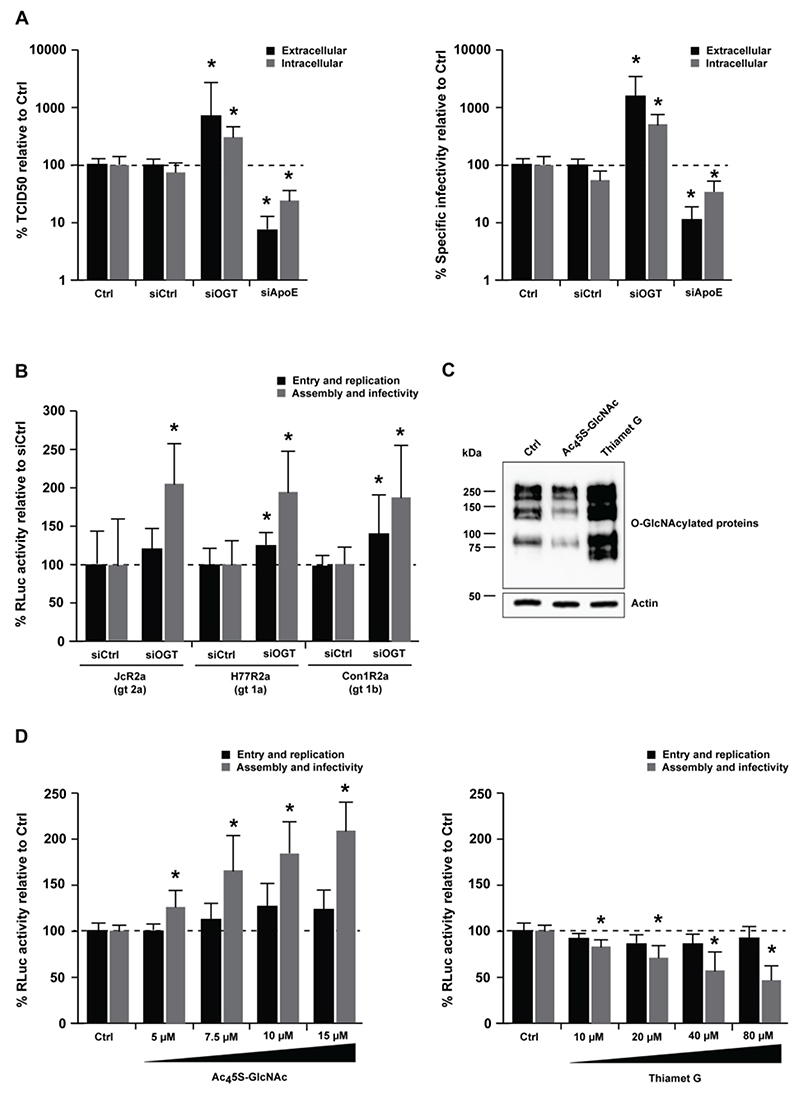
Figure 4. Silencing of OGT affects HCV morphogenesis and infectivity.
(A) Analysis of HCV infectivity. Huh7.5.1 cells were transfected with siCtrl, a pool of siRNA against OGT or ApoE as a loss-of-function control to perturb HCV assembly, prior to infection with HCVcc (Jc1) two days later (entry and replication). Mock-transfected cells were used as control (Ctrl). After another 48h, intra- and extracellular HCVcc particles were used to infect naïve Huh7.5.1 cells (assembly and infectivity). Virus supernatants of Huh7.5.1 cells were assayed by (left) endpoint dilution assay (TCID50). Intra- and extracellular HCV RNA was purified and analyzed by RT-qPCR to calculate (right) the specific infectivity (TCID50/RNA). Data are expressed as mean percentage as compared to control ± s.d. Results are from four independent experiments in triplicate. The dashed line indicates values from control-transfected cells set at 100%. Statistics: *, p-value < 0.05, Mann-Whitney test. (B) Genotype-independent effect of OGT on HCV infection. Huh7.5.1 cells were transfected with siCtrl or siOGT prior to infection with HCVcc JcR2a (genotype 2a), H77R2a (genotype 1a) or Con1R2a (genotype 1b). Experiments were carried out and analyzed as described in A. Data are expressed as mean percentage of Renilla luciferase activity as compared to control ± s.d. Results are from three independent experiments in quadruplicate. The dashed line indicates values from control-transfected cells set at 100%. Statistics: *, p-value < 0.05, Mann-Whitney test. (C) Activity of OGT/OGA inhibitors on O-GlcNAcylation. The activity of Ac45S-GlcNAc (OGT inhibitor) or Thiamet G (OGA inhibitor) on O-GlcNAcylation of proteins in Huh7.5.1 cells was demonstrated by Western blot as described in Supplementary Methods. (D) Effect of O-GlcNAcylation on HCV infectivity. Huh7.5.1 cells were electroporated with HCVcc (JcR2a), prior to treatment with increasing concentrations of Ac45S-GlcNAc (OGT inhibitor, left) or Thiamet G (OGA inhibitor, right) 4h later. After 96h, supernatants were transferred onto naïve Huh7.5.1 cells and electroporated cells were lysed to determine luciferase activity. Luciferase activity in infected Huh7.5.1 cells was assessed 72h later. Data are expressed as mean percentage as compared to control ± s.d. Results are from three independent experiments in quadruplicate. The dashed line indicates values from vehicle-treated cells set at 100%. Statistics: *, p-value < 0.05, Mann-Whitney test.

