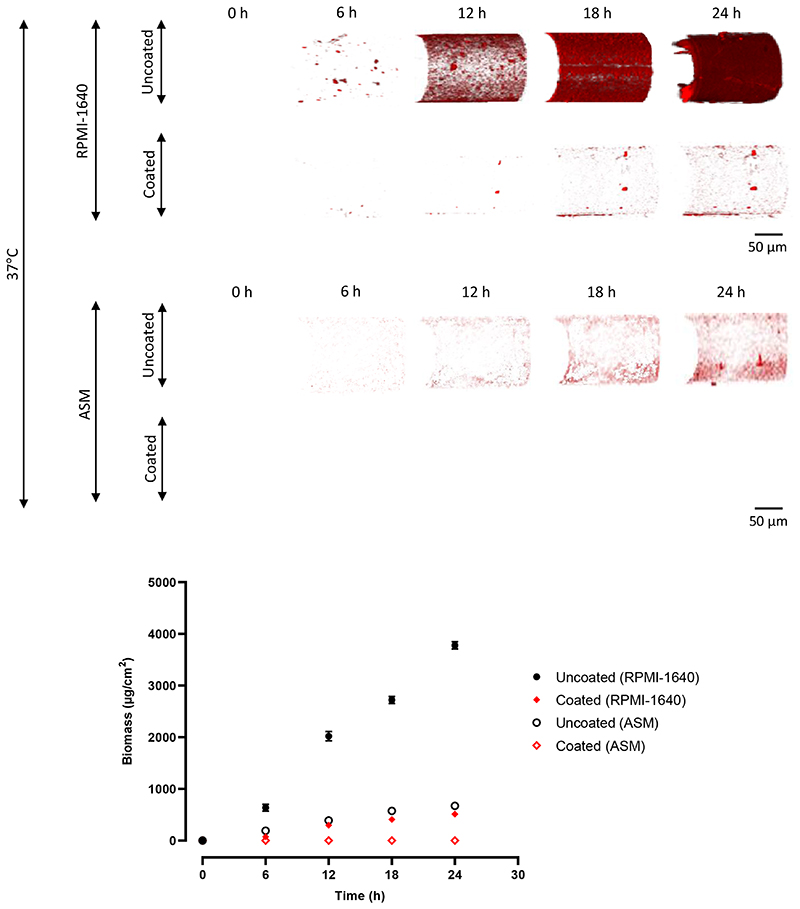
Figure 2. Confocal microscopy quantification of P. aeruginosa biofilms on optical fibres.
3D confocal images of P. aeruginosa biofilms on uncoated and coated optical fibres at 6 h intervals for 24 h, at 37°C, in RPMI-1640 and ASM. The red areas represent biofilm, as the P. aeruginosa was transformed to express fluorescent mCherry (excitation = 587 nm, emission = 610 nm). The scale bar is 50 μm for all images. Quantification of biomass for all images, using COMSTAT, with a fluorescence threshold of 56 AU. Points are mean biomass ± s.d, N = 3.

