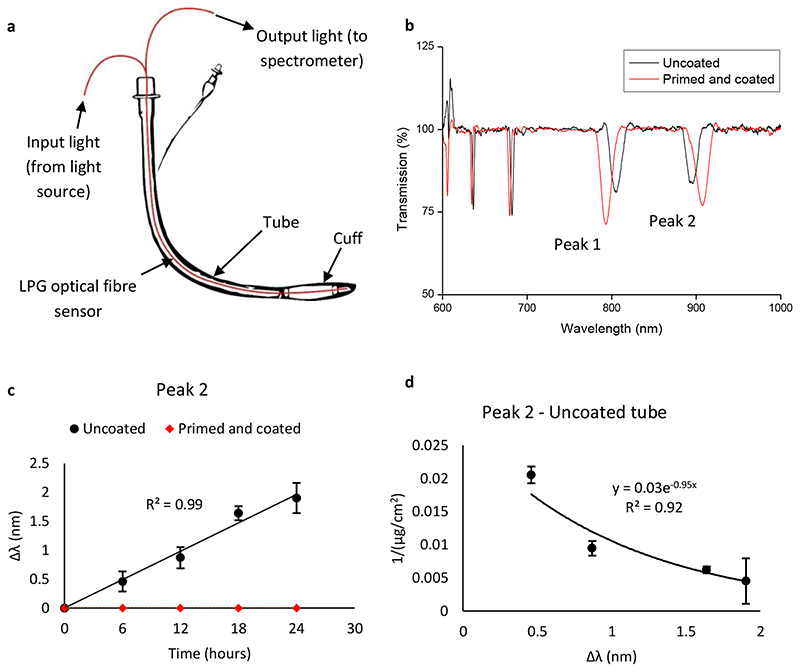
Figure 4. Response from LPG sensor instrumented ETT.
a, Schematic of prototype ETT, with LPG sensor incorporated into the lumen. b, Processed optical (transmission) spectrum from uncoated and coated LPG sensors immersed in P. aeruginosa cultures at 0 h, at room temperature. Two attenuation bands/peaks are present, labelled ‘Peak 1’ and ‘Peak 2’. c, Wavelength shift (Δλ) of peak 2 from uncoated and coated LPG sensor-ETT systems immersed in P. aeruginosa in ASM for 24 h, at room temperature. Error bars are ± s.d, N = 3. d, Plot of peak 2 wavelength shift from c against the inverse biomass of P. aeruginosa biofilms grown on uncoated ETT sections in ASM, at room temperature (Figure S2). An exponential function is fitted to the data. Error bars are ± s.d, determined from 3 biological replicates.

