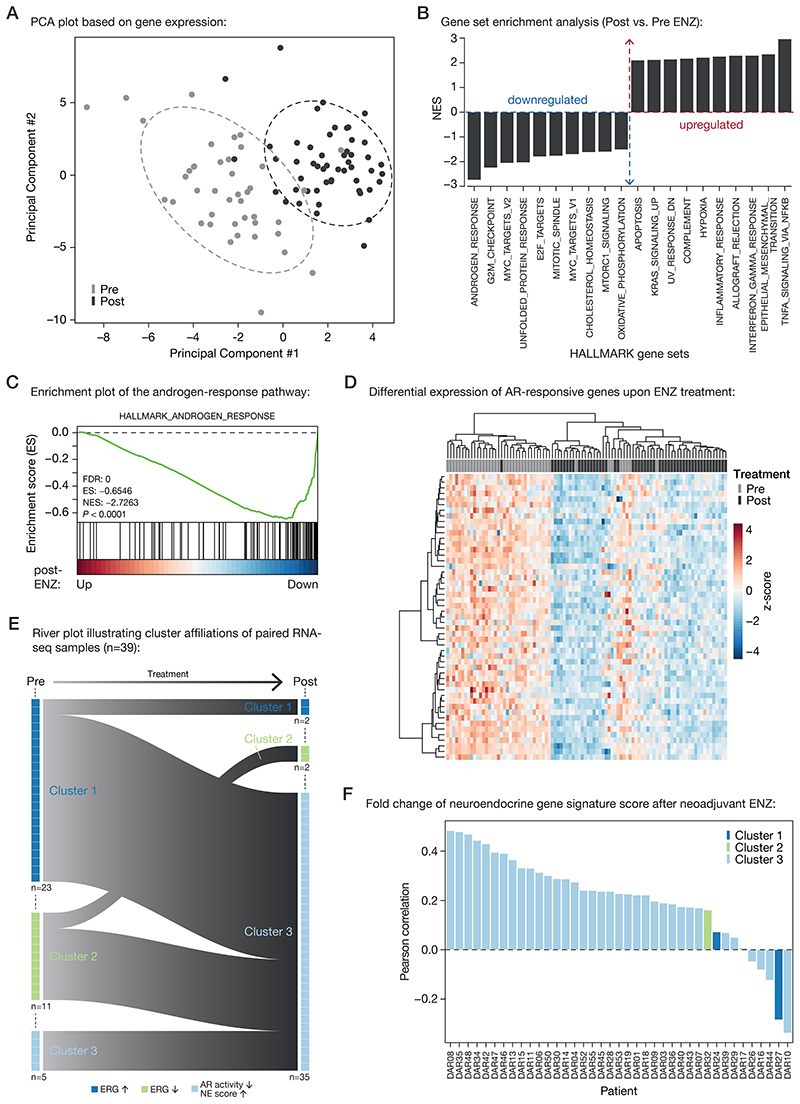
Figure 4. Neoadjuvant ENZ deactivates AR signaling and induces neuroendocrine (NE)-like gene expression signatures.
(A) Principal component analysis (PCA) plot based on gene expression data. Color indicates pre-treatment (gray) and post-treatment (black) samples. Ellipses are based on the 80% confidence interval.
(B) Gene set enrichment analyses (GSEA) for Hallmark gene sets. Shown are the top differentially enriched pathways upon ENZ treatment. Y-axis indicates the normalized enrichment score (NES).
(C) Enrichment plot of the Hallmark Androgen Response pathway. Genes are ranked by differential expression upon ENZ treatment based on patient RNA-seq data (post vs. pre). Y-axis indicates enrichment score (ES). GSEA statistics (FDR, ES, NES, nominal P-value) are indicated.
(D) Unsupervised hierarchical clustering of pre- and post-treatment RNA-seq samples based on the expression of AR-responsive genes. Color scale indicates gene expression (z-score).
(E) River plot showing state transitions between Clusters 1 (dark blue), Cluster 2 (green) and Cluster 3 (light blue) for paired pre-treatment and post-treatment RNA-seq samples (n=39). Number of samples assigned to each cluster before and after treatment as well as the hallmarks per cluster are indicated.
(F) Waterfall plot depicting the Pearson correlation of neuroendocrine gene expression signature fold changes upon ENZ treatment per patient. Colors indicate the patients cluster affiliations after treatment.

