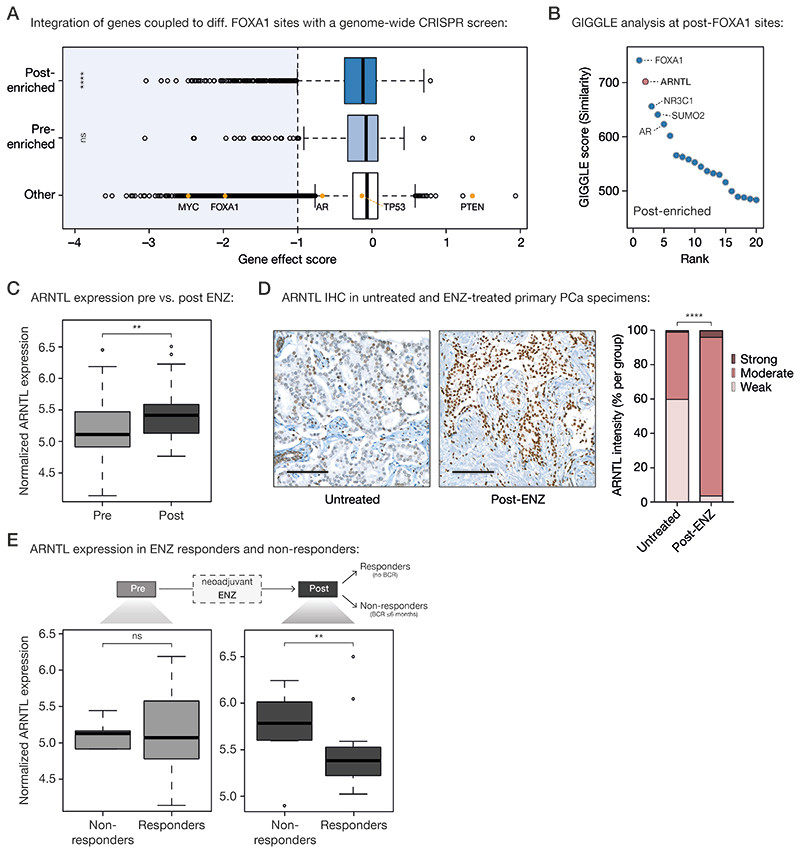
Figure 5. Acquired FOXA1 sites drive key-survival genes that are under control of circadian rhythm regulator ARNTL.
(A) Boxplot showing DepMap (20Q1) genome-wide loss-of-function CRISPR screen data for VCaP PCa cells, separately analyzing the gene effect score of genes associated with post-enriched FOXA1 sites (top), pre-enriched FOXA1 sites (middle) or all other tested genes (bottom). Differential FOXA1 binding sites were coupled to their respective target genes using H3K27ac HiChIP data. Indicated as controls are PCa-relevant driver genes: oncogenes MYC, FOXA1, AR, TP53 and tumor suppressor PTEN. The recommended stringent gene effect score cutoff of -1 is shown (dotted vertical line) and all genes passing the essentiality threshold are highlighted in light blue. ns, P > 0.05; ****, P < 0.0001 (Fisher’s exact test).
(B) Dot plot representing ranked GIGGLE similarity scores for transcriptional regulators identified at post-treatment FOXA1 sites. The top 20 identified factors are shown, and the 5 most enriched factors are labeled.
(C) Boxplot showing normalized ARNTL gene expression before and after 3 months of neoadjuvant ENZ treatment. **, P < 0.01 (Mann-Whitney U-test).
(D) Representative ARNTL immunohistochemistry (IHC) stainings (left) and quantification of ARNTL staining intensity (right) in tissue microarrays consisting of prostatectomy specimens from untreated patients (not receiving neoadjuvant ENZ; n=110) and DARANA patients post-ENZ (n=51). Scale bars, 100 μm. ****, P < 0.0001 (Fisher’s exact test).
(E) Boxplots depicting normalized ARNTL gene expression in ENZ non-responders (biochemical recurrence (BCR) ≤ 6 months; n=8) and responders (no BCR; n=29) in the pre- (left) and post- (right) treatment setting separately. ns, P > 0.05; **, P < 0.01 (Mann-Whitney U-test).

