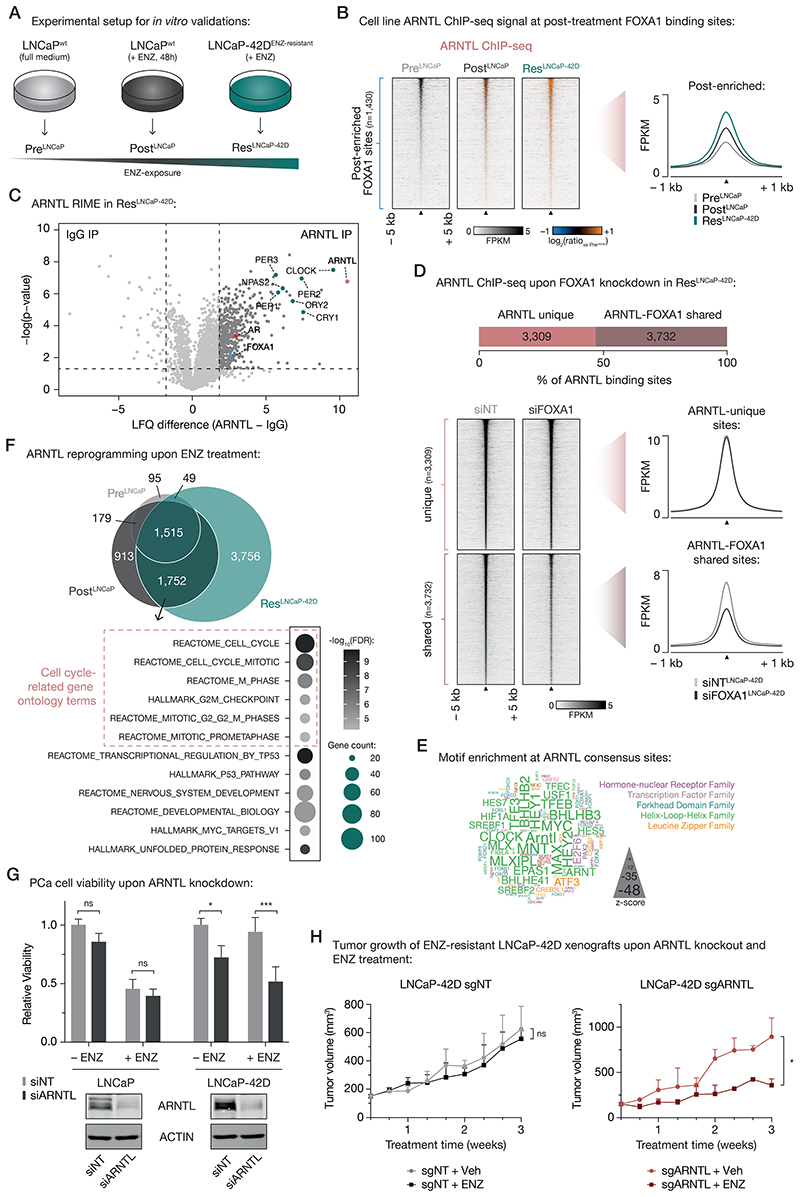
Figure 6. Treatment-induced dependency on ARNTL in ENZ-resistant PCa cells.
(A) Experimental setup for in vitro validation experiments.
(B) Tornado plots (left) and average density plot (right) visualizing ARNTL ChIP-seq signal (in FPKM) at post-enriched FOXA1 binding sites in untreated (PreLNCaP), short-term ENZ-treated (PostLNCaP), and ENZ-resistant NE-like LNCaP cells (ResLNCaP-42D). Data are centered at post-treatment FOXA1 peaks depicting a 5-kb (heatmaps) or 1-kb (density plots) window around the peak center. Heatmap color depicts the ChIP-seq signal compared to the untreated condition (PreLNCaP), with blue indicating lower peak intensity and orange indicating higher peak intensity. (n=2)
(C) Volcano plot depicting ARNTL interactors in ENZ-treated LNCaP-42D (ResLNCaP-42D) cells over IgG control. Significantly enriched interactors are highlighted and significance cutoffs are shown as dotted lines (label-free quantification (LFQ) difference ≥ 1.8; P ≤ 0.05; n = 4).
(D) Stacked bar chart (top) indicating the fraction of ARNTL binding sites in ENZ-treated LNCaP-42D (ResLNCaP-42D) cells that are ARNTL unique (n=3,309) or shared with FOXA1 (n=3,732). Tornado plots (lower left) and average density plot (lower right) visualize ARNTL ChIP-seq signal (in FPKM) at ARNTL unique or ARNTL-FOXA1 shared binding sites in LNCaP-42D cells upon transfection with non-targeting siRNA (siNT) or siFOXA1. Data are centered at ARNTL peaks depicting a 5-kb (heatmaps) or 1-kb (density plots) window around the peak center. (n=2)
(E) Word cloud shows motif enrichment at ARNTL consensus sites (n=1,515) shown in (E). The font size represents the z-score and colors correspond to transcription factor families. Since the human ARNTL motif is not part of the tested database, the homologous mouse motif (Arntl) was included.
(F) Venn diagram (top) indicating the overlap of ARNTL binding sites in all tested cell line conditions (PreLNCaP, PostLNCaP, ResLNCaP-42D). For each condition, only peaks present in both replicates were included. Gene ontology terms for ARNTL-bound gene sets uniquely shared between PostLNCaP and ResLNCaP-42D conditions are presented below. Overlapping ARNTL binding sites (n=1,752) were coupled to their respective target genes using H3K27ac HiChIP data. Color indicates the gene set enrichment (FDR q-value) and size depicts the number of genes that overlap with the indicated gene sets. Cell cycle-related gene ontology terms are highlighted.
(G) Bar chart (top) showing relative cell viability of LNCaP (left) and LNCaP-42D (right) cells upon transfection with non-targeting siRNA (siNT) or siARNTL, and exposure to ENZ. Treatment is indicated and data is shown relative to the untreated (– ENZ) siNT condition per cell line (n=3). Western blots (bottom) indicate ARNTL protein levels in LNCaP (left) and LNCaP-42D (right) cells following siRNA-mediated silencing of ARNTL for 48 h. Transfection with siNT and staining for ACTIN are included as controls for siRNA treatment and protein loading, respectively. Images are representative of three independent experiments. ns, P > 0.05; *, P < 0.05; ***, P < 0.001 (two-way ANOVA followed by Tukey’s multiple comparisons test).
(H) Growth curves depict tumor volume (measured 3 times per week using calipers) of non-targeting control (sgNT) or ARNTL knockout (sgARNTL) LNCaP-42D xenografts upon daily treatment with vehicle-alone (sgNT +Veh: n=4; sgARNTL +Veh: n=3) or ENZ (sgNT +ENZ: n=4; sgARNTL +ENZ: n=2). ns, P > 0.05; *, P < 0.05 (t-test).

