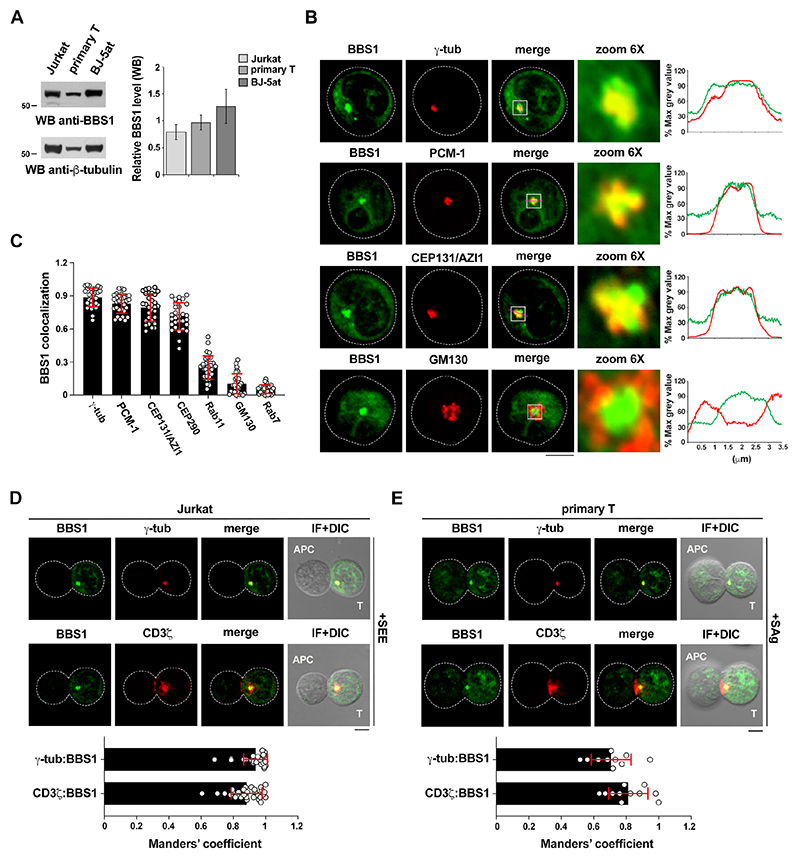
Figure 1. BBS1 localizes at the pericentrosomal compartment and accumulates at the T cell IS.
(A) Left, Immunoblot analysis of BBS1 in lysates of Jurkat, primary T and BJ-5at cells (n≥3). The migration of molecular mass markers is shown. Right, Quantification of the relative protein expression normalized to β-tubulin. (B) Immunofluorescence analysis of BBS1-GFP-expressing Jurkat cells co-stained for markers of different intracellular compartments. Right, Intensity profiles along the white lines within the selected area in the overlay images for each channel are shown. Raw pixel intensity signals were normalized to maximum intensity pixel of each channel (% max grey value). (C) Quantification (mean±S.D.) using Manders’ coefficient of the weighted colocalization of each marker with GFP in stable or transient Jurkat BBS1-GFP transfectants (10 cells/sample, n≥3). Representative images (medial optical sections) are shown in (B) and (S2A). (D,E) Immunofluorescence analysis of γ—tubulin and CD3ζlocalization in Jurkat cells (D) or primary T cells (E) transfected with a construct encoding BBS1-GFP and conjugated with SEE/SAg-loaded Raji cells (APCs) for 15 min. Bottom, Quantification (mean±S.D.) using Manders’ coefficient of the weighted colocalization of the indicated markers with GFP. The distance of BBS1-GFP (μm) from the T cell-APC contact site, measured from the point of maximal intensity of the GFP signal, was 2.99±0.85 in Jurkat cells (10 cells/sample, n=3) and 1.13±0.85 in primary T cells (≥10 cells, n=2). Size bar, 5 μm.

