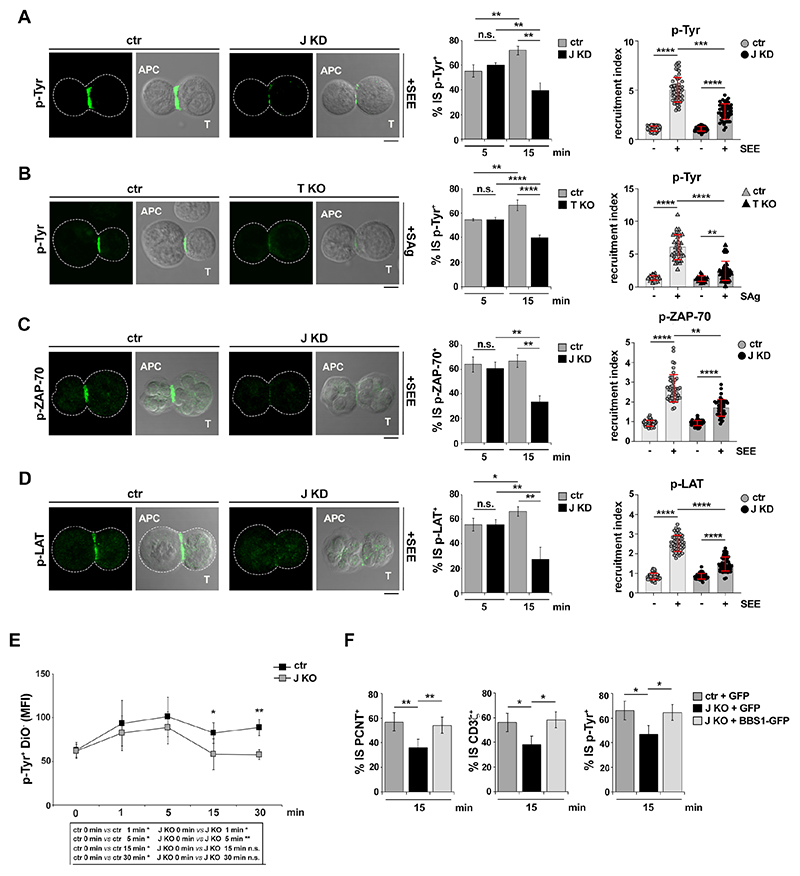
Figure 3. BBS1 is required for sustained signaling at the IS.
A,B) Immunofluorescence analysis of tyrosine phosphoproteins (p-Tyr) in conjugates of r control (ctr) and BBS1KD (J KD) Jurkat cells (A), or control (ctr) and BBS1KO (T KO) primary T cells (B), with SEE/SAg-loaded Raji cells (APCs). Representative images (medial optical sections) of the conjugates formed in the presence of SEE/SAg are shown (see Fig.S4A,D for SEE/SAg-independent conjugates). Left, Quantification (%) of 5-min and 15-min antigen-specific conjugates harboring p-Tyr staining at the IS (≥25 cells/sample, n=3, unpaired two-tailed Student’s t-test). Right, Relative p-Tyr fluorescence intensity at the IS in 15-min conjugates of control (ctr) and BBS1KD (J KD) Jurkat cells (A), or control (ctr) and BBS1KO (T KO) primary T cells (B), with Raji cells in the absence or presence of SEE/SAg (≥10 cells/sample, n=3, Kruskal-Wallis test). (C,D). Immunofluorescence analysis of p-ZAP-70 (C) or p-LAT (D) in conjugates of control (ctr) and BBS1KD (J KD) Jurkat cells with SEE-loaded Raji cells (APCs). Representative images (medial optical sections) of the conjugates formed in the presence of SEE are shown (see Fig.S4E,F for SEE-independent conjugates). Graphs, left to right, Quantification (%) of 5-min and 15-min SEE-specific conjugates harboring p-ZAP-70 (C) or p-LAT (D) at the IS (≥25 cells/sample, n=3, unpaired twotailed Student’s t-test) (left). Relative p-ZAP-70 (C) or p-LAT (D) fluorescence intensity at the IS in 15-min conjugates of control (ctr) and BBS1KD (J KD) Jurkat cells with Raji cells in the absence or presence of SEE (≥15 cells/sample, n=3, Kruskal-Wallis test) (right). (E) Time course flow cytometric analysis of protein tyrosine phosphorylation in conjugates of control (ctr) and BBS1KO (J KO) Jurkat cells with SEE-loaded Raji cells (APCs). Raji cells were labelled with DiO and the analysis was carried out gating on DiO-negative (DiO-) cells. Mean fluorescence intensities (MFIs) of PTyr+DiO- cells at different time points (n≥3, Mann-Whitney test) are shown. (F) Quantification (%) of 15-min SEE-specific conjugates of control (ctr) or BBS1KO (J KO) Jurkat cells showing PCNT, CD3ζ and p-Tyr staining at the IS (≥ 25 cells/sample, n=3, unpaired two-tailed Student’s t-test). Both ctr and J KO were transfected with the empty vector (ctr+GFP, J KO+GFP), while J KO were also transfected with the same vector encoding wildtype BBS1 (J KO+BBS1-GFP). Size bar, 5 μm. The data are expressed as mean±SD. ****P≤0.0001; ***P≤0.001; **P≤0.01; *P≤0.05; n.s., not significant.

