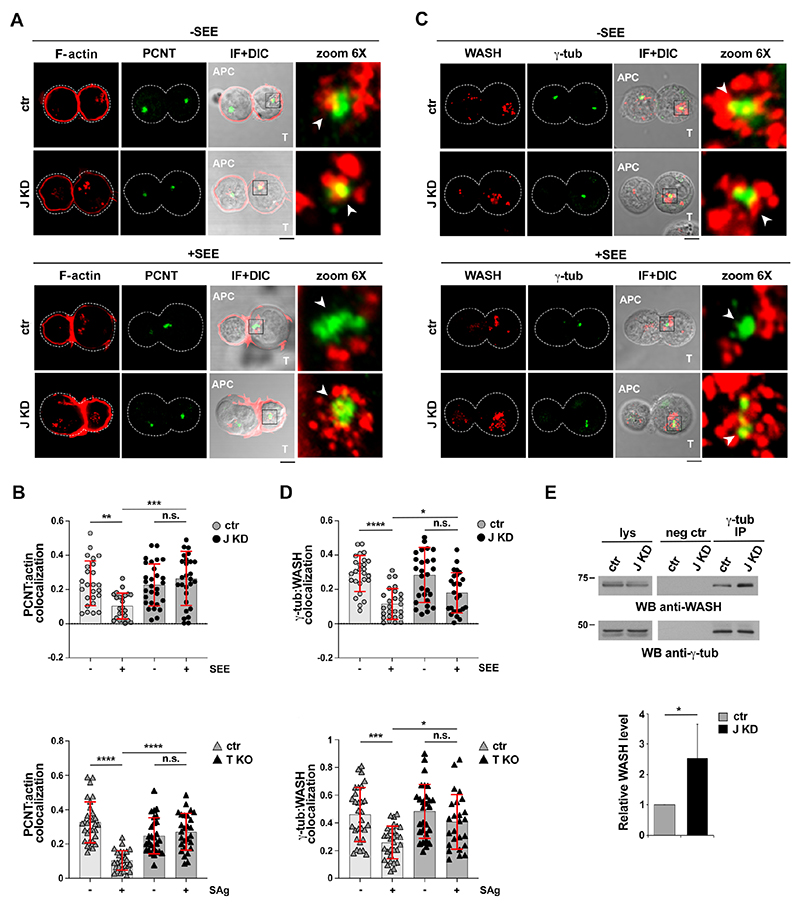
Figure 4. BBS1 is required for centrosomal F-actin clearance during IS formation.
(A) Immunofluorescence analysis of centrosomal F-actin (phalloidin) in 15-min conjugates of control (ctr) and BBS1KD (J KD) Jurkat cells with Raji cells (APCs) in the absence or presence of SEE. Conjugates were co-stained for PCNT. (B) Quantification using Manders’ coefficient of the weighted colocalization of PCNT with centrosomal F-actin (see Fig.S4C for mask generation) in 15-min conjugates of control (ctr) and BBS1KD (J KD) Jurkat cells (top), or control (ctr) and BBS1KO (T KO) primary T cells (bottom), with Raji cells in the absence or presence of SEE/SAg (≥10 cells/sample, n=3, Kruskal-Wallis test). (C) Immunofluorescence analysis of centrosomal WASH in 15-min conjugates of control (ctr) and BBS1KD (J KD) Jurkat cells with Raji cells (APCs) in the absence or presence of SEE. Conjugates were costained for γ—tubulin. (D) Quantification using Manders’ coefficient of the weighted colocalization of γ—tubulin with centrosomal WASH (see Fig.S4C for mask generation) in 15-min conjugates of control (ctr) and BBS1KD (J KD) Jurkat cells (top), or control (ctr) and BBS1KO (T KO) primary T cells (bottom), with Raji cells in the absence or presence of SEE/SAg (≥10 cells/sample, n=3, Kruskal-Wallis test). Representative images (medial optical sections) are shown. Size bar, 5 μm. (E) Immunoblot analysis of γ—tubulin-specific immunoprecipitates from lysates of control (ctr) and BBS1KD (J KD) Jurkat cells. A preclearing control (proteins that bound to Protein-A-Sepharose before addition of primary antibody) is shown (neg ctr). Total cell lysates (lys) were included in each gel to identify the migration of the tested proteins. The migration of molecular mass markers is shown. The histogram below shows the relative intensities of the immunoreactive bands corresponding to WASH (J KD vs ctr) normalized to the immunoprecipitated γ—tubulin (mean±SD, n=3, ctr value=1, one-sample t-test). ****P≤0.0001; ***P≤0.001; **P≤0.01; *P≤0.05; n.s., not significant.

