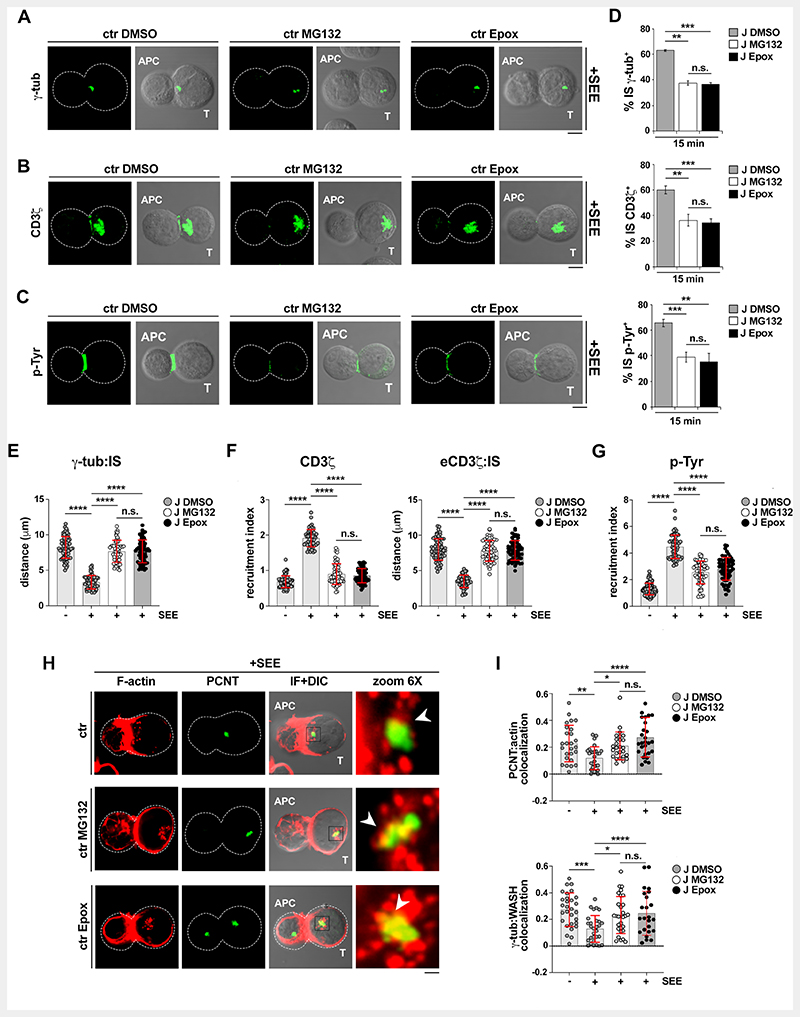
Figure 6. Centrosome translocation to the IS is regulated by the proteasome.
(A,B,C,H) Immunofluorescence analysis of centrosome (γ-tubulin) (A), CD3ζ (B), tyrosine phosphoproteins (p-Tyr) (C) and centrosomal F-actin (H) in control (ctr) Jurkat cells, pre-treated with either carrier (DMSO) or the proteasome inhibitors MG132 or epoxomicin (Epox), and conjugated with Raji cells (APCs) in the absence or presence of SEE for 15 min. Representative images (medial optical sections) of the conjugates formed in the presence of SEE are shown. (D) Quantification (%) of 15-min SEE-specific conjugates harboring γ—tubulin (top), CD3ζ (middle) and p-Tyr (bottom) staining at the IS (Epox) (≥25 cells/sample, n=3, unpaired two-tailed Student’s t-test). (E-G) Measurement of the distance (μm) of the centrosome (γ—tubulin) from the T cell-APC contact site (E), relative CD3ζ fluorescence intensity at the IS (F) (left), measurement of the distance (μm) of the endosomal TCR-CD3 pool (eCD3ζ) from the T cell-APC contact site (F) (right) and relative p-Tyr fluorescence intensity at the IS (G) in control (ctr) Jurkat cells, pre-treated with either carrier (DMSO) or the proteasome inhibitors MG132 or epoxomicin (Epox), and conjugated with Raji cells (APCs) in the absence or presence of SEE for 15 min (≥10 cells/sample, n=3, Kruskal-Wallis test). (I) Quantification using Manders’ coefficient of the weighted colocalization of PCNT with centrosomal F-actin (top) or γ—tubulin with centrosomal WASH (bottom) in control (ctr) Jurkat, pre-treated with either carrier (DMSO) or the proteasome inhibitors MG132 or epoxomicin (see Fig.S4C for mask generation), and conjugated with Raji cells (APCs) in the absence or presence of SEE for 15 min (≥10 cells/sample, n=3, Kruskal-Wallis test). Size bar, 5 μm. The data are expressed as mean±SD. ****P≤0.0001; ***P≤0.001; **P≤0.01; *P≤0.05; n.s., not significant.

