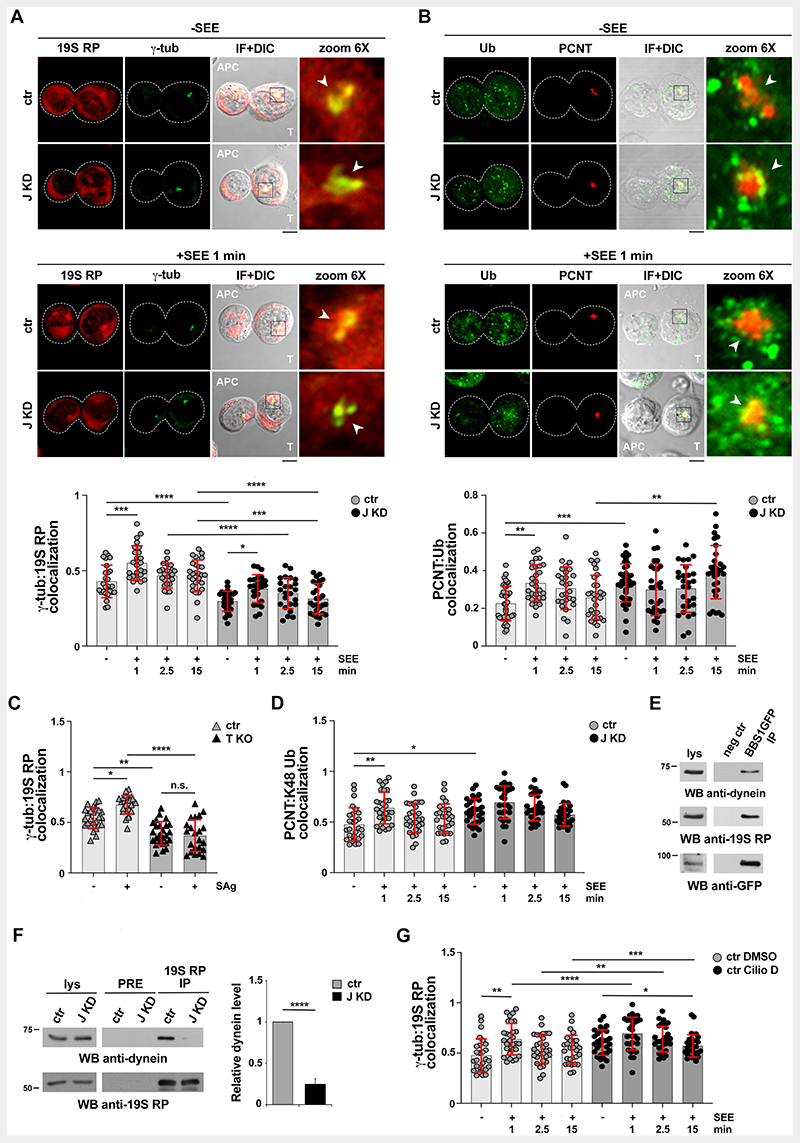
Figure 7. The 19S regulatory subunit of the proteasome is recruited to the centrosome during IS assembly through BBS1-mediated coupling to dynein.
(A,B,D) Time-course immunofluorescence analysis of 19S RP recruitment (A), ubiquitylated proteins (Ub) (B) and K48-linked polyubiquitylated proteins (K48 Ub) (D) to the centrosome in conjugates of control (ctr) and BBS1KD (J KD) Jurkat cells conjugated with SEE-loaded Raji cells (1, 2.5, 15 min) or to Raji cells without SEE (1 min) seeded on poly-L-lysine-coated slides. Conjugates were co-stained with γ—tubulin (A) or PCNT (B,D). Representative images (medial optical sections) of 1-min conjugates are shown. Quantification using Manders’ coefficient of the weighted colocalization of 19S RP (A), Ub (B) and K48 Ub (D) with the centrosomal markers γ—tubulin (A) and PCNT (B,D) (see Fig.S4C for mask generation) (≥10 cells/sample, n=3, One-way ANOVA test or Kruskal-Wallis test based on normality distribution of different data sets). (C) Immunofluorescence analysis of 19S RP recruitment to the centrosome (γ—tubulin) in 1-min conjugates of control (ctr) and BBS1KO (T KO) T cells added to Raji cells in the presence or absence of SAg. Quantification using Manders’ coefficient of the weighted colocalization of 19S RP with the centrosome (γ—tubulin) (≥ 10 cells/sample, n=3, Kruskal-Wallis test). (E,F) Immunoblot analysis of GFP-specific immunoprecipitates from lysates of BBS1-GFP-expressing cells (E). Immunoblot analysis of 19S RP-specific immunoprecipitates from lysates of control (ctr) and BBS1KD (J KD) Jurkat cells (F). A preclearing control (proteins that bound to Protein-A-Sepharose before addition of primary antibody) is shown (neg ctr). Total cell lysates (lys) were included in each gel to identify the migration of the tested proteins. The migration of molecular mass markers is shown. The histogram in (F) shows the relative intensities of the immunoreactive bands corresponding to dynein (intermediate chain 2, clone 74.1) (J KD vs ctr) normalized to immunoprecipitated 19S RP (mean±SD, n≥3, ctr value=1, one-sample t-test). (G) Time-course immunofluorescence analysis of 19S RP recruitment to the centrosome (γ—tubulin) in conjugates of control Jurkat cells treated either with carrier (DMSO) or 50 μM ciliobrevin during conjugate formation with SEE-loaded Raji cells (1, 2.5, 15 min) or with Raji cells without SEE (1 min) seeded on poly-L-lysine-coated slides. Quantification using Manders’ coefficient of the weighted colocalization of 19S RP with the centrosome (γ—tubulin) (≥10 cells/sample, n=3, Kruskal-Wallis test). Size bar, 5 μm. The data are expressed as mean±SD. Only statistically significant differences are shown. ****P≤0.0001; ***P≤0.001; **P≤0.01; *P≤0.05.

