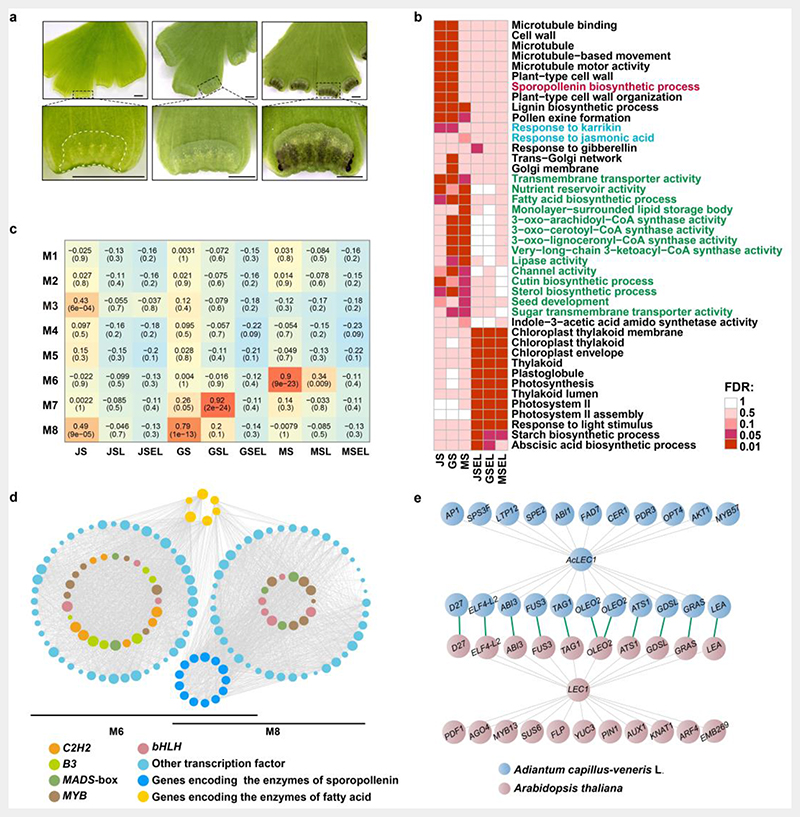
Fig. 3. Expression profile and gene network analysis during homosporangium development.
The top row shows the underside (adaxial side) of pinnae (leaves) with sporangia in three developmental stages. From left to right are the juvenile, green, and mature stages. Bar = 1 mm. The margins of the pinnae in boxes are enlarged into the images in the second row to show curled false indusia and adaxial generated sori. The false indusium with homosporangium was also outlined by a white dash line. Bar = 1 mm.
b. Heat map visualization of representative gene ontology (GO) terms for tissue-enriched genes. The colors from red to white indicate false discovery rate (FDR) as follows: 0.01, 0.05, 0.1, 0.5, and 1, respectively. The listed GO terms are for significant differentially expressed genes (FDR < 0.01). JS, juvenile sporangium; GS, green sporangium; MS, mature sporangium; JSEL, juvenile-sporangium-excised leaf; GSEL, green-sporangium-excised leaf; MSEL, mature-sporangium-excised leaf. Functions related to storage compound accumulation are indicated in green; functions related to the stress response are indicated in blue; functions related to spore development are indicated in red.
c. Heatmap of the correlations between the detected co-expression modules (M1-M8) and the indicated homosporangium tissues. The heatmap indicates the Pearson correlation coefficient (PCC) value from the correlation analysis of the overrepresentation of genes and the various tissues. Boxes contain the PCC value and P-value from the correlation analysis.
d. Regulatory network and the connection among transcription factors (TFs) and structural genes involved in sporopollenin (light blue point) and fatty acid (orange point) biosynthesis. The size of the point areas represents the copy numbers. The left and right TF circles are based on the M8 and M6 co-expression modules, respectively.
e. The LEC1 regulatory networks in A. capillus-veneris and Arabidopsis. All orthologous relationships are linked with green lines, and co-expression genes are linked by gray lines.

