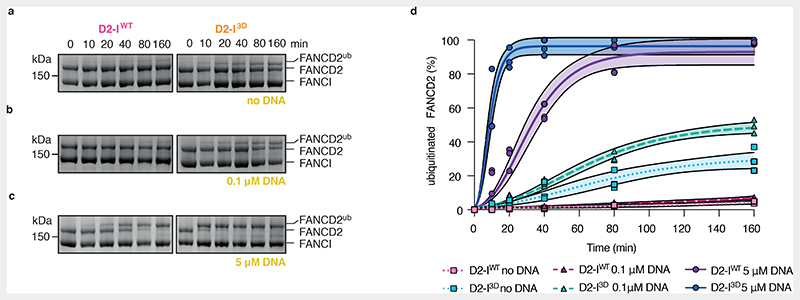
Fig. 5. Phosphomimetic mutations result in exposure of target lysines in D2-I.
(a-c) Monoubiquitination assays of 2 μM D2-IWT and D2-I3D complexes performed in the absence of DNA (a), in the presence of 0.1 μM 44-bp dsDNA (b), or in the presence of 5 μM 44-bp dsDNA (c). FANCD2 ubiquitination was analyzed using SDS-PAGE and Coomassie staining. (d) Quantification of FANCD2 monoubiquitination assays shown in panels a-c. Data obtained from three independent assays were quantified as percentage of ubiquitinated FANCD2. Replicate data were fitted using a global non-linear regression function described in the Methods. Data points of each replicate (symbols), the corresponding mean (central solid line) and the 95% confidence interval (shaded area between dashed lines) are shown.

