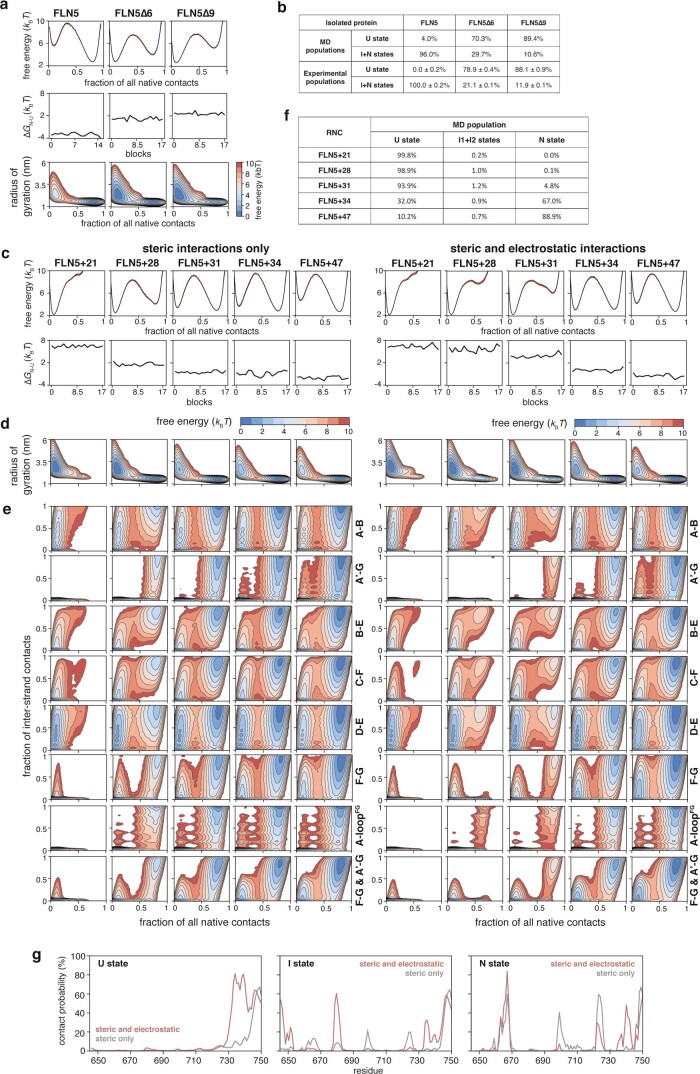
Extended Data Fig. 7. Coarse-grained molecular dynamics simulations of the co-translational folding of FLN5.
a, CG structure-based model MD simulations of isolated FLN5 and its C-terminal truncations (FLN5∆6 and FLN5∆9) used to calibrate all subsequent MD simulations. We introduced non-bonded interactions in the form of native contacts generated from the FLN5 crystal structure (1qfh) as they dominate the folding landscape based on the principle of minimal frustration57. We used Parallel Biased Metadynamics38 to enhance sample transitions between different states using ten collective variables: fraction of all native contacts, radius of gyration, and the fraction of the native contacts between each pair of strands (A-B, A’-G, B-E, C-F, C-C’, D-E, F-F’, and F-G). Shown in the plots are the free energy landscapes of folding in 1D (top) and 2D (against the radius of gyration); the middle plot shows convergence of the free energy of folding calculated across the whole trajectory based on the block analysis. b, Populations of FLN5 states determined by CG models (by analysis of free energy landscapes shown in a) and by 19F NMR, showing good agreement at the chosen temperature for MD simulations. The CG models do not simulate cis-trans isomerisation (and thus cannot model the transP742 in the intermediates30), and therefore, as an approximation, all folded states were compared against the summed total of native and intermediate state populations from experimental data instead. c, Top plot shows free energy landscapes of folding determined for 6 RNCs by CG models. Bottom plot shows convergence of the free energy of folding calculated across the whole trajectory based on the block analysis. d, Free energy landscapes of folding plotted against radius of gyration for each RNC. e, Free energy landscapes of folding plotted against fraction of contacts between pairs of β-strands or loop regions (as indicated on the right of each plot) for each RNC. f, Populations of unfolded, intermediate and native states obtained for each RNC by the CG models. g, Contact probability between the unfolded, intermediate, and native states of the RNC and the ribosome from CG models with (red) and without electrostatic interactions (grey), plotted per residue.

