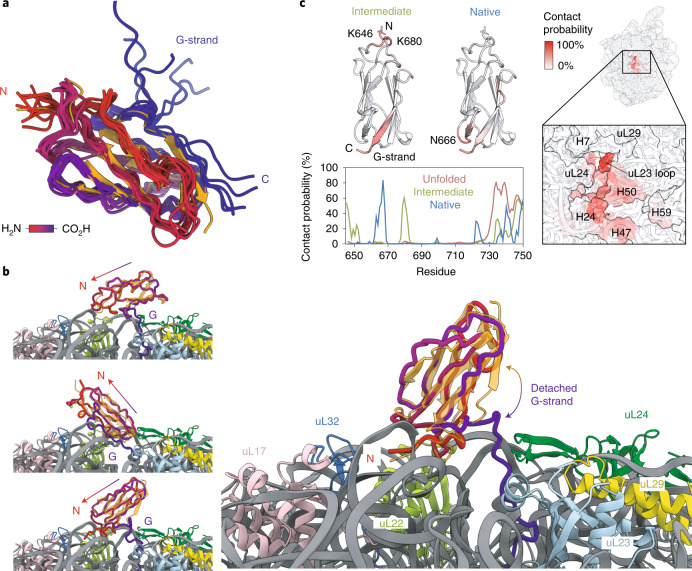
Fig. 4. Structural ensemble of the FLN5 co-translational intermediate state determined by MD simulations.
a, Structural ensemble of the FLN5 + 34 intermediate from CG models. The 10 most populated intermediate conformations are superimposed with the native FLN5 crystal structure (orange; PDB no. 1QFH) and coloured from N terminus (red) to C terminus (blue). Ribosome and linker are not shown for clarity. b, Examples of the FLN5 + 34 intermediate structures, with the FLN5 crystal structure aligned. Colours as in a. Arrow indicates axis from C to N terminus. c, The bottom left plot shows the contact probability between the FLN5 + 34 in its unfolded, intermediate and native states and the ribosome from CG models. Contact probabilities of the intermediate and native states are coloured on the FLN5 structures (above) with regions of highest probability highlighted. The right depicts the contact probability between the FLN5 + 34 intermediate and the ribosome, mapped onto the ribosome surface.

