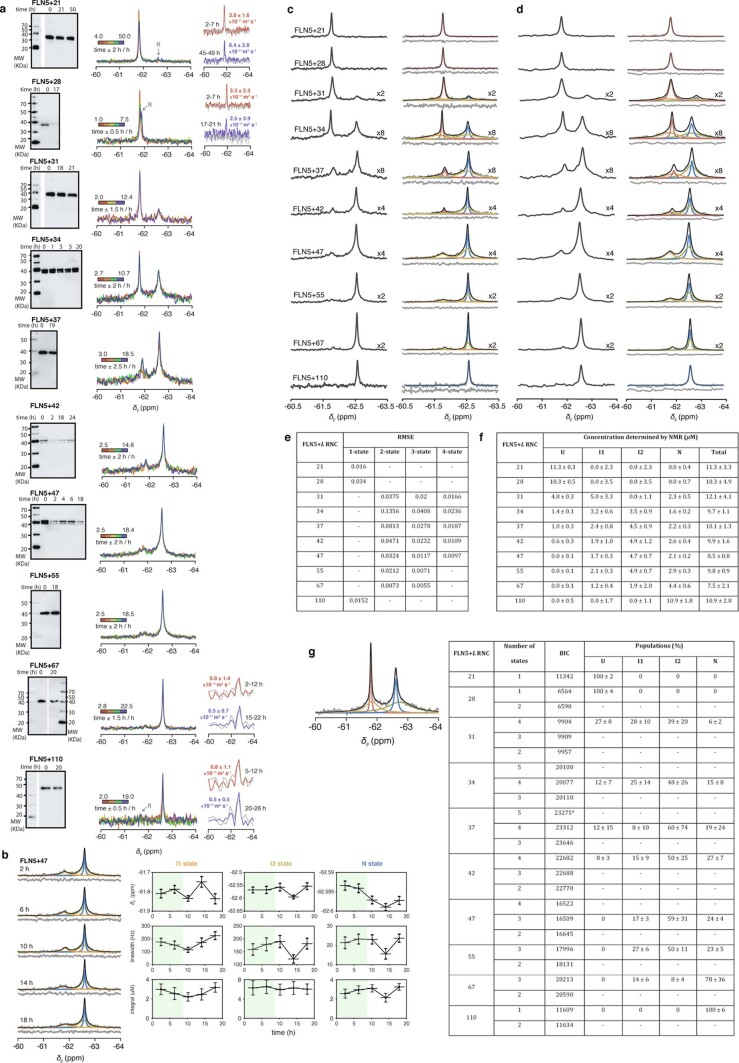
Extended Data Fig. 2. Assessment of sample integrity and lineshape fitting of FLN5 RNCs.
a, For each RNC construct, the sample was subjected to (left) anti-histidine western blot analysis following SDS-PAGE of aliquots of a sample incubated in parallel to NMR experiments, evaluated by the observation of the tRNA-bound (that is ribosome-bound) form of the nascent chain, representative data shown from two independent repeats; (middle) an assessment of its 1D 19F NMR spectra recorded in timed succession; and where sensitivity was permissible, (right) 19F STE experiments were recorded, in an interleaved manner with 1D 19F experiments, with a diffusion delay of 100 ms and at gradient strengths of 5% (coloured) and 95% (grey) of the maximum gradient strength Gmax of 0.54 T m-1, and summed to gain sufficient signal-to-noise to determine its diffusion coefficient. b, As a representative example of the assessment of 1D 19F NMR spectra over time, (left) spectra of FLN5 + 47 are shown (grey), fitted to Lorentzian lineshapes (coloured), with residuals after fitting shown below. (right) Quantitative analysis of the chemical shift, linewidth and integrals for each RNC state, taken from fittings of spectra over time; green shading indicates the time in which the RNC sample was deemed to be stable and intact. Data from these times were summed together and used for the final spectrum. Error bars indicate errors calculated from bootstrapping of residuals from NMR line shape fittings. 1D 19F NMR spectra of the FLN5 RNCs were fitted to line shapes using exponential line broadening functions prior Fourier transformation to compare spectroscopic sensitivity of broad lines (increases with stronger line broadening) and resolution between different peaks (improves with weaker line broadening). Shown in the figure are exponential line broadenings at c 10 Hz, and d 40 Hz. Analysis using either exponential function results in the same quantifications. e, Root-mean-square errors (RMSE) obtained for the fitting of different numbers of lineshapes to 1D 19F NMR spectra of the FLN5 RNCs. f, Concentrations of each state were determined by lineshape fitting of spectra, and normalised to a sample concentration of 10 µM as measured by its absorbance at a wavelength of 280 nm, and to which the total summed NMR integral was compared against. No significant deviation was found between the concentration determined by NMR integration and by absorbance, indicating that the lineshape fits did not significantly over- or underfit the data. g, Time domain analysis of FLN5 RNCs of varying lengths. NMR data, shown in Fig. 2, were fitted in the time domain using exponential functions, combined with fits for zero-order phase and baseline correction in the frequency domain. An example of NMR data fitted using time domain analysis is shown (in the frequency domain, that is following Fourier transformation). The Bayesian information criterion (BIC) value was calculated for each RNC, as an indication of the number of resonances, and thus states, which are most likely to represent the data. The model with the lowest BIC was chosen for analysis in the frequency domain. (*) Fitting with an additional state accounting for <1.5% population. Populations determined for each state by time domain analysis are consistent with those obtained by frequency domain analysis.

