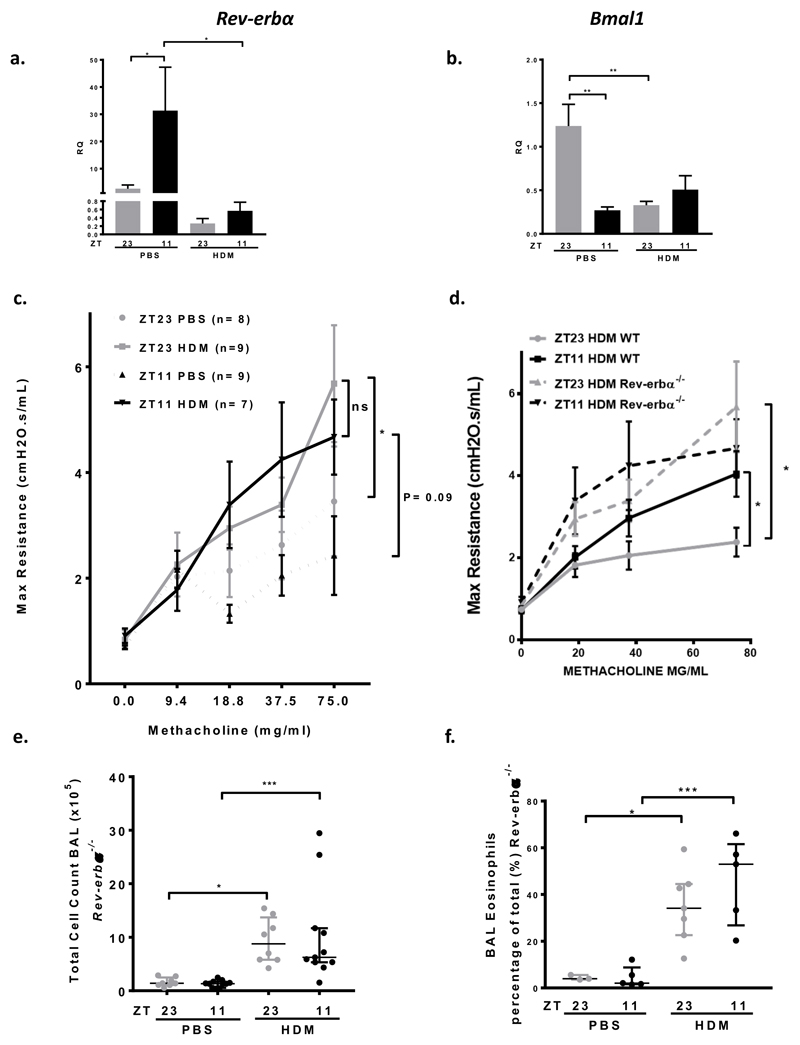
Fig 3. REV-ERBα is a negative repressor of AHR.
a. Expression of Rev-erbα in WT murine lung tissue, relative to the expression of Gapdh. There was a time of day difference in the expression of Rev-erbα in PBS challenged mice; Rev-erbα expression at ZT11 was significantly greater than at ZT 23 (* P < 0.05). This time of day difference was lost after HDM challenge; there was a reduction in expression of Rev-erbα at both challenge times (* P < 0.05 at ZT 11). 1 way ANOVA, followed by Tukey’s multiple comparison test. Data is presented as mean ± SEM (n=5-7 per treatment group, in duplicate). Grey bars-ZT23, Black bars ZT11.
b. Expression of Bmal1 in WT murine lung tissue, relative to the expression of Gapdh. There was a time of day difference in the expression of Bmal1 in PBS challenged mice; Bmal1 expression at ZT23 was significantly greater than at ZT11 (** P < 0.01), in anti-phase to Rev-erbα expression. This time of day difference was lost after HDM challenge; there was a reduction in expression of Bmal1 at both challenge times (** P < 0.01 at ZT23). 1 way ANOVA, followed by Tukey’s multiple comparison test. Data is presented as mean ± SEM (n=7-11 per treatment group, in duplicate).
c. Airway hyperresponsiveness to increasing doses of methacholine was measured in Rev-erbα-/- mice, as maximum airway resistance using Flexivent. There was no difference in the slopes of the methacholine dose response curves between Rev-erbα-/- mice challenged with HDM at either ZT11 or ZT23 (mixed linear modelling). There was no difference in the maximal AHR measured after 75mg/ml of methacholine in Rev-erbα-/- mice after challenge at ZT11 and ZT23 (Mann Whitney U). Mice challenged with HDM exhibited increased airway resistance after 75mg/ml methacholine at ZT11 (P=0.09) and at ZT23 (* P=0.03) compared to control (PBS challenged) mice, Mann Whitney U test. In Rev-erbα-/- mice baseline airway resistance is higher in control (PBS treated) mice at ZT23 compared to ZT11. This is in anti-phase to WT mice (Fig 1). Data is presented as mean± SEM. Grey lines-ZT23, HDM challenged, grey dotted line-ZT23, PBS control, black line-ZT11, HDM challenged and black dotted line-ZT11, PBS control.
d. AHR was significantly increased in Rev-erbα-/- mice after challenge with HDM compared to WT controls. After HDM challenge at ZT23 there was a significant increase in the maximal response to methacholine in Rev-erbα-/- mice compared to WT mice (* P < 0.05) mean ± SEM (n=7-9 per treatment group), 1 way ANOVA, followed by Tukey multiple comparison adjustment. Grey lines-ZT23 HDM challenged WT, black line-ZT11, HDM challenged WT, grey dotted line-HDM challenged ZT23 Rev-erbα-/-, and black dotted line-HDM challenged ZT11 Rev-erbα-/-.
e. Total cells recovered from BAL fluid from Rev-erbα-/- mice significantly increased after HDM challenge at both times, compared to control, PBS challenged mice (* P < 0.05 ZT23, ** P < 0.01 ZT11). There was no time of challenge difference in total cells in BAL in either PBS challenged or HDM challenged groups. 1 way ANOVA, followed by Tukey’s multiple comparison test, (n=8-12 per treatment group). Data is presented as median ± IQR.
f. BAL eosinophils (measured as a percentage of the total) significantly increased after HDM challenge at both times in Rev-erbα-/- mice, compared to PBS challenged control mice (* P < 0.05 ZT23, *** P < 0.001 ZT11). There was no time of challenge difference in percentage eosinophils in BAL in either PBS challenged or HDM challenged groups. 1 way ANOVA, followed by Tukey’s multiple comparison test, (n=8-12 per treatment group). Data is presented as median ± IQR.

