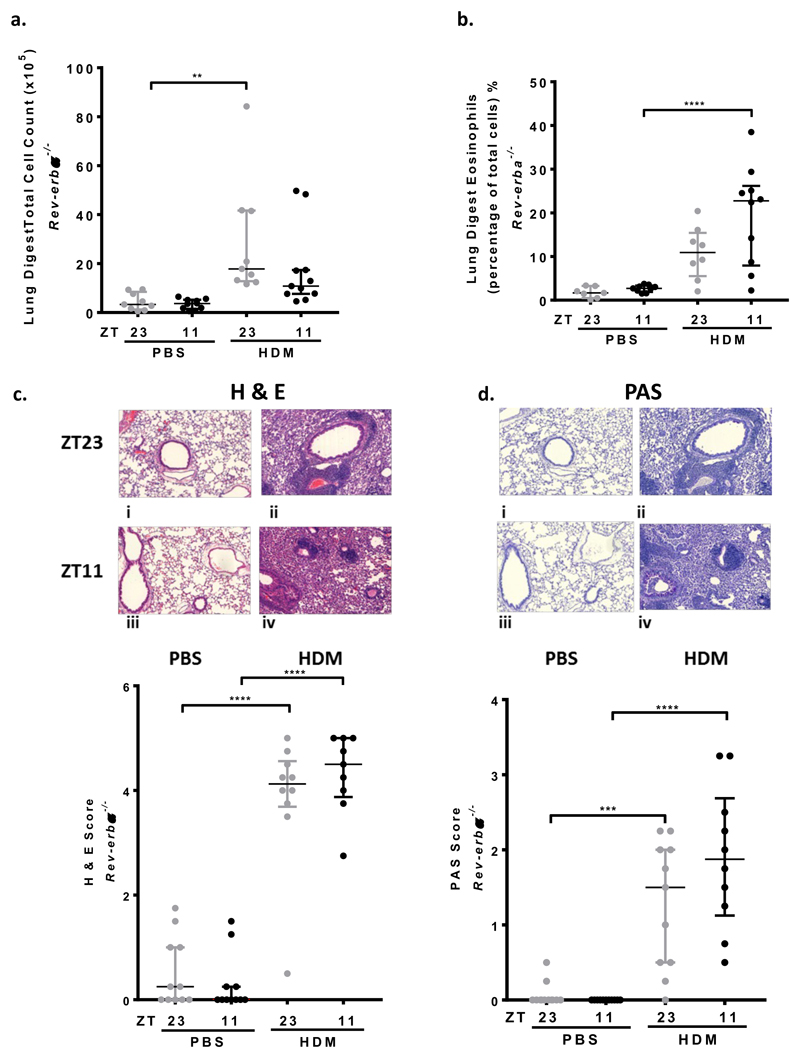
Fig 4. Lung inflammation in Rev-erbα-/- mice after HDM challenge show no time of challenge difference.
a. Total cell count from lung digests increased after HDM challenge, compared to control, although only reached significance at ZT23 (** P < 0.01). There was no time of challenge difference. Data is presented as median ± IQR (n=8-11 per treatment group) and analysed using a 1 way ANOVA, followed by Tukey’s multiple comparison test.
b. Eosinophils in lung digests increased after HDM challenge, only reaching significance at ZT11 (**** P < 0.0001); there is no time of challenge difference. Data is presented as median ± IQR (n=8-11 per treatment group) and analysed using a 1 way ANOVA, followed by Tukey’s multiple comparison test.
c. HDM challenge at ZT11 and ZT23 caused predominantly eosinophilic inflammation around the bronchioles and blood vessels (haemoatoxylin and eosin staining (H&E)) compared to PBS challenge, histology sections i-iv and scatter plot, **** P < 0.0001 at ZT23 and ZT11. There was no significant time of challenge effect in PBS or HDM challenged groups. Data is presented as median ± IQR and analysed using a 1 way ANOVA, followed by Tukey’s multiple comparison test, (n=9-11 per treatment group).
d. Periodic Shift Staining (PAS) shows increased mucus present on the bronchial epithelium in the lungs of WT mice treated with HDM at both ZT11 and ZT23. There was no PAS staining seen in PBS treated mice (i-iv) and scatter plot, *** P < 0.01 at ZT23 and **** P<0.0001 at ZT11). There was no time of challenge differences after PBS or HDM challenge. Data is presented as median ± IQR; data analysed using 1 way ANOVA, followed by Tukey’s multiple comparison test, (n=9-11 per treatment group).

