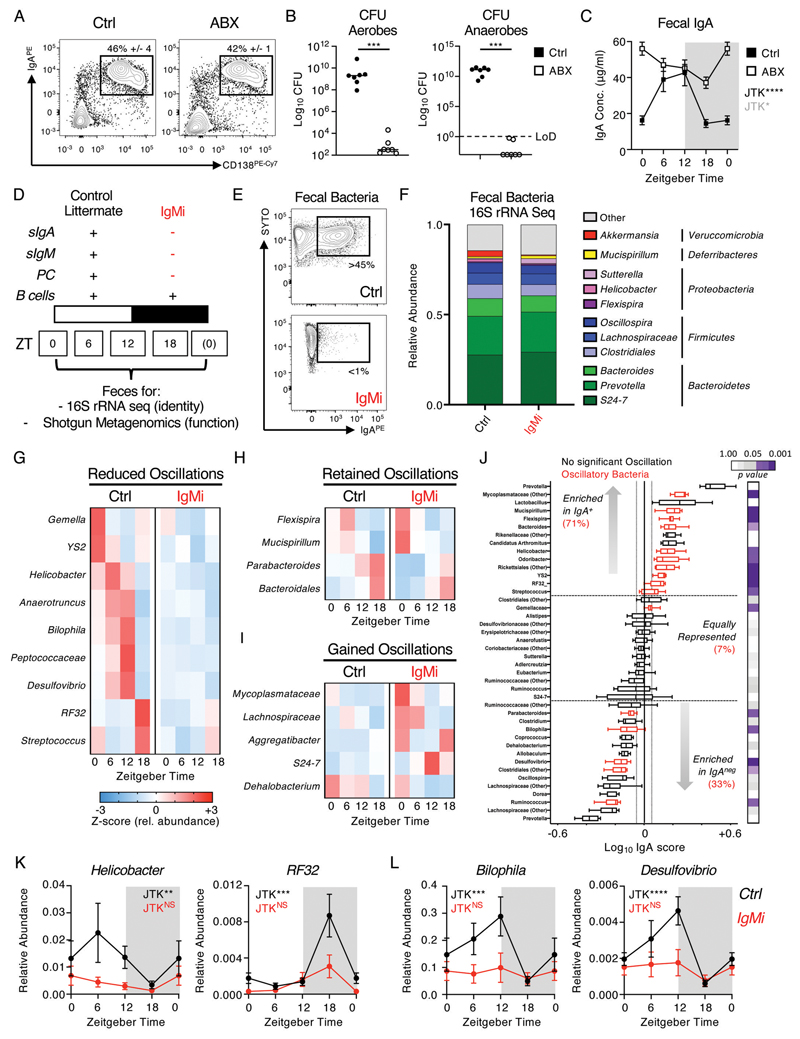
Figure 4. Bidirectional interactons between the microbiota and host IgA responses regulate circadian rhythmicity of commensal microbes.
A) Small intestinal IgA+ PC frequencies in mice receiving a cocktail of antibiotics (ABX) ad lib for 4 days (representative of n=5 mice per group and two independent experiments), B) colony forming units (CFU) or commensal microbes measured under aerobic and anaerobic culture conditions (representative of n=7 mice per group, pooled from two independent experiments) and C) fecal IgA measured over four circadian time points (ZT0 double plotted) from control and ABX treated mice representative of n=5 mice per group and two independent experiments. D) Summary of features of the IgMi mouse model. E) Representative measurement of IgA-binding to fecal bacteria in IgMi mice or littermate wild type control mice (Ctrl). F) Global analysis of average microbiota composition in Ctrl and IgMi animals elucidated by 16S rRNA Sequencing of fecal pellet-derived bacteria. G-I) Z-score heatmaps indicating average relative abundance of significantly oscillatory microbial genera in Ctrl mice and IgMi mice from serially sampled fecal bacteria taken at ZT0, 6, 12 and 18 (JTK cycle p<0.05). J) IgA-Seq analysis of fecal bacteria isolated from Ctrl animals. Bacteria determined to exhibit oscillatory patterns in G-I are highlighted in red and the relative percent enrichment of oscillatory bacteria in IgA+ or negative fractions are indicated, legend indicates JTK cycle p values. IgA enrichment indicate as log10 score. K+L) Individual data sets for selected bacteria identified as oscillatory in Ctrl animals and perturbed in IgMi mice (ZT0 data double plotted). All 16S rRNA sequencing and IgA Seq data representative of two independent experiments with n=4-5 animals per genotype, per ZT time point. P values for panel B were determined using a non-parametric, unpaired Mann-Whitney t-test and panels C and G-L using JTK Cycle. All data shown as +/- SEM unless otherwise indicated, * p< 0.05, ** p< 0.01, *** p< 0.001, **** p< 0.0001.

