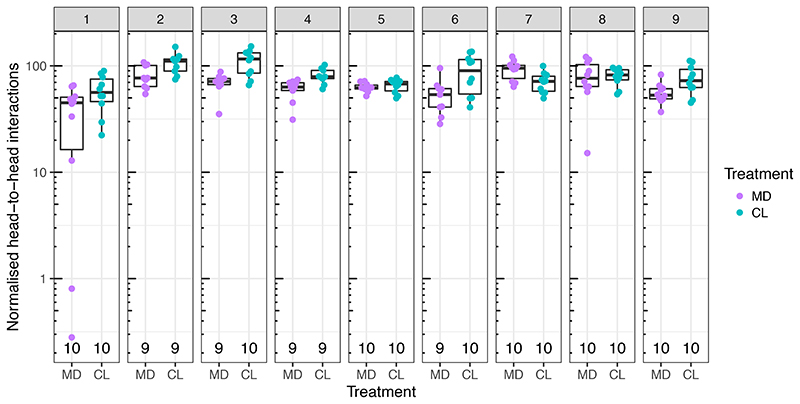
Extended Data Fig. 8. Social interactions in a subset of tracked bees by gut microbiota treatment group and experimental replicate.
The plot shows the number of head-to-head interactions of the tracked bees for which we also obtained gut microbiota and metabolome data, normalised by group size. For six of these 180 bees the number of head-to-head interactions could not be retrieved due to deterioration of the tags at the end of the week of tracking. Boxplots show the median and first and third quartiles, while upper and lower whiskers report largest and lowest values within 1.5 times the interquartile ranges above and below the 75th and 25th percentiles, respectively.

