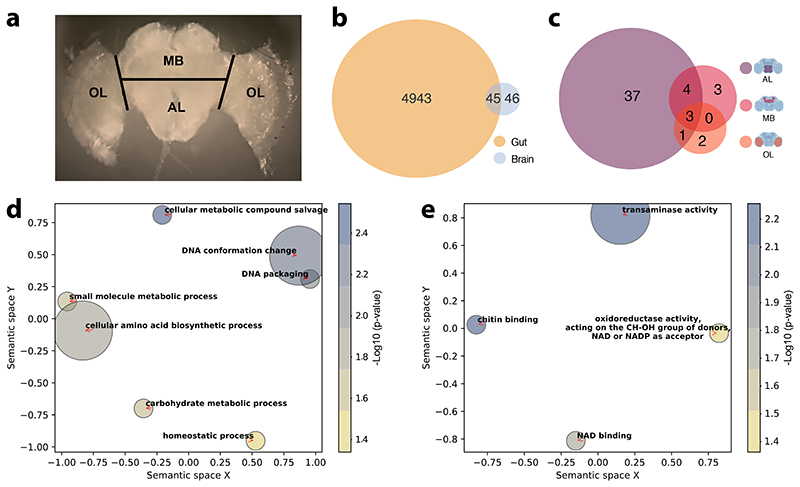
Figure 3. The gut microbiota alters gene expression in the gut and in the AL brain region.
(A) Brain regions dissected for RNA sequencing. Black lines indicate the performed incisions. (B) Venn diagram reporting overlap in differentially expressed genes in the gut and brain across all contrasts of gut microbiota colonization treatments (CL, CL_13, and CL_Bifi) versus microbiota-depleted (MD) controls (for the brain, the reported number of DEGs includes both whole-brain and brain-region-specific comparisons, see Supplementary Table 6 and Methods). (C) Venn diagram reporting overlap in brain-region-specific contrasts of all gut microbiota colonization treatments (CL, CL_13, and CL_Bifi) versus microbiota- depleted (MD) controls. The brain icons were created with BioRender.com. Semantic similarity scatterplots summarize the list of enriched (D) Biological process and (E) Molecular function GO terms of all the 91 DEGs identified in the brain. The scatterplots show GO terms as circles arranged such that those that are most similar in two-dimensional semantic space are placed nearest to each other. Circle color represents –log10 of enrichment P value, as calculated by hypergeometric tests for over-representation: (D) cellular metabolic compound salvage (GO:0043094), P=0.003, DNA conformation change (GO:0071103), P=0.007, DNA packaging (GO:0006323), P=0.008, cellular amino acid biosynthetic process (GO:0008652), P=0.015, small molecule metabolic process (GO:0044281), P=0.024, carbohydrate metabolic process (GO:0005975), P=0.029, homeostatic process (GO:0042592), P=0.046; (E) transaminase activity (GO:0008483), P=0.006, chitin binding (GO:0008061), P=0.007, NAD binding (GO:0051287), P=0.019, oxidoreductase activity, acting on the CH-OH group of donors, NAD or NADP as acceptor (GO:0016616), P=0.044.

